Curated OER
Coming to Know F and C
Students collect temperatures using a probe and examine data. In this temperature lesson students complete an activity using a graphing calculator.
Curated OER
Mmm, Mmm, M&M's
Here is another version of the classic M&M math lesson. In this one, upper graders utilize the ClarisWorks Spreadsheet program in order to document the data they come up with from their bags of M&M's. After making their initial...
Curated OER
Equations from Unit Rates
Your class can become linear equations masters, as they calculate the rate of change of a function. They observe different types of coordinates as they relate to a graph, then use the Ti-navigator to move the line around and draw...
Curated OER
Exploring Transformations with Matrices
A page right out of the Holt Geometry book. Use a graphing calculator and graph paper to explore transformations with matrices.
Curated OER
Sign of the Derivative
Learn how to investigate the change in a graph by dragging the cursor to observe the change in the function. They use the TI calculator to graph their parabola.
Texas Instruments
Exploring Basic Equations
Learners explore equations with constants, variables and with exponents. They identify and define variables, constants, exponents, expressions, and equations, as well as give an example of each. Your class will also draw their...
Curated OER
Influence and Outliers
Using the TI-Nspire calculator, statisicians identify outliers and their effect on the least-squares regression line. In finding the line of best fit, they determine what points will affect the least squares regressions and what points...
Worksheet Web
Using Pictographs
If one ice cream cone represents three ice cream scoops, and Bob has four ice cream cones, then how many scoops does Bob have? Learners solve these kind of questions with their new understanding of pictographs.
Curated OER
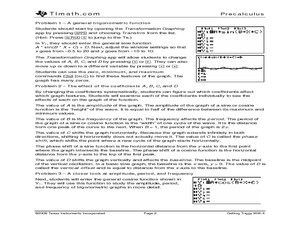
Getting Triggy With It
The concept of sine and cosine is explored in this activity where high schoolers graph sine and cosine graphs using a transformation application on the graphing calculator. Students change the coefficients for the amplitude, period,...
Curated OER
Match Me!
Young learners explore motion graphs in this instructional activity. They investigate distance-time plots as they move in a specific way in front of the CBR in an attempt to make a motion plot that matches a given plot. Pupils explore...
Curated OER
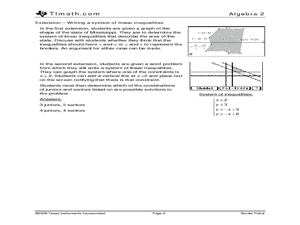
Border Patrol
Young scholars investigate systems of linear inequalities as they apply to an area of land. They practice graphing systems and determine if a point lies in the solution.
Curated OER
Zeros of Polynomials
Young scholars graph polynomials. In this Algebra II lesson, students investigate the graph of a polynomial to determine the value and the number of zeros. This lesson requires the use of a graphing calculator.
Curated OER
Graphic Designing with Transformed Functions
Teach your class how to transform a graph! By identifying the domain and range of the functions, learners can observe the parabola and find the vertex of the transformed graph.
Curated OER
Logarithmic Transformations
Using the TI calculator to visualize and make predictions, high schoolers perform transformation vertically and horizontally on logarithmic graphs in order to solve problems.
Curated OER
The Disappearing Kelp Forest
Learners observe the effect "El Nino" left on kelp plants and sea urchins. They analyze the data collected by researchers, by graphing it on a TI calculator. Before graphing and analyzing the data, you may want to revisit the events of...
Texas Instruments
Land Erosion - Running Off With Soil
Learners evaluate the relationship between rainfall and runoff of a small island for one year. For this rainfall vs. runoff lesson, students analyze the relationship between the rainfall and the runoff on Barro Colorado Island over a...
Texas Instruments
Exploring Tangents
Explore the concept of tangent lines. In this tangent line lesson, learners graph a circle and two lines on their graphing calculator using Cabri Jr. High schoolers construct the lines so that they both intersect at a given point and are...
Curated OER
Exponential Transformations
Perform transformations on exponential functions! Teach your class how to perform dilation, compression, and translation. They graph exponential functions using the TI Calculator.
Curated OER
Multiplying Monomials
High schoolers differentiate between linear and quadratic functions. In this algebra instructional activity, students write equations of graphs and graph a function from an equation. They also identify the slope and y-intercept.
Curated OER
Exploring the Area Under a Curve
Using TI-89, mathematicians explore and investigate Riemann sums to estimate the area under the graphs of intervals by drawing and illustrating rectangles. They review and practice the concepts of summation notation and area formulas to...
Curated OER
What's the Spin?
Learners use the CABRI application for their graphing calculator to rotate, translate, and reflect triangles. They use graphing calculators and follow detailed directions to manipulate triangles in specified ways. There are three...
Texas Instruments
Continuity and Differentiability 1
Pupils examine graphs for continuity and differentiability in this calculus lesson. They observe piecewise functions to see where continuity and differentiability come into play. Learners finish by graphing their equation on the TI...
Curated OER
Angles Formed By Parallel Lines
Young scholars explore the concept of angles formed by parallel lines.They graph two parallel lines cut by a transversal, then measure the angles formed by the transversal and record the data in a table. Learners make conjectures about...
Curated OER
Cabri Jr. Inscribed Angles
Young scholars construct inscribed angles using Cabri Jr. They draw a circle on their graphing calculator, then construct an inscribed angle and measure its angle measures. Learners drag the inscribed angle around the circle. They make...


