Curated OER
TI-Nspire Activity: What Does Your Representation Tell You?
By learning to select the best representation for three meal plans, students compare three meal plans to determine the best choice. Data for the meal plans is sorted on a table, as an algebraic equation, and graphed on a coordinate grid....
Texas Instruments
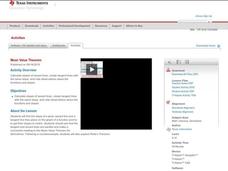
Mean Value Theorem
Students calculate the slopes of secant lines. For this calculus lesson, students graph tangent and secant lines using the coordinate plane. They use the Ti calculator to graph and observe the lines.
Curated OER
Biodiversity and Ecosystems
Middle schoolers differentiate between biotic and abiotic factors in this science lesson plan. Learners collect data for the experiment and analyze the data after graphing it using the CBL 2. This experiment is split into two different...
Curated OER
Let the River Run
Pupils examine deposits found in a river in this science lesson plan. They collect data of sediment deposit found in the Mississippi river, then graph and analyze their data using the TI.
Curated OER
Health of Aquatic Life a Real Problem
Learners explore the health of aquatic life in this science lesson They measure and track the oxygen level in the water to determine the health of the aquatic life. They collect this data using the TI explorer to graph and analyze their...
Curated OER
FCAT Real World Solving Linear Equations/Systems
Pupils relate real life situation to the equations, graphs and inequalities. They model real life scenarios using matrices and draw conclusions from their data. This lesson plan is aligned with FCAT.
Curated OER
Chill Out: How Hot Objects Cool
Teach how to explore exponential equations. In this Algebra II lesson, learners investigate the graph that occurs as a hot liquid cools. Students model the data algebraically.
Curated OER
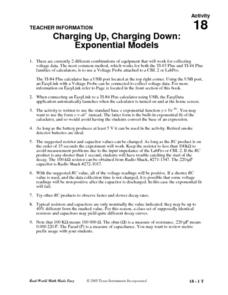
Charging Up, Charging Down
Learners collect and analyze voltage data. Then, they investigate exponential functions using the TI and a Voltage Probe and graph their data and analyze it using a table.
Curated OER
Getting Started with the TI-Navigator™ System: What's My Line?
Learners analyze linear functions in this algebra instructional activity. They explore the meaning of slope and the slope-intercept form of a line as they investigate the effect changing parameters on the graph of a linear function.
Curated OER
Rational Numbers
Young scholars investigate rational numbers in this algebra lesson plan. They graph systems of equations and use technology to find the point of intersection. They need a TI for this assignment.
Curated OER
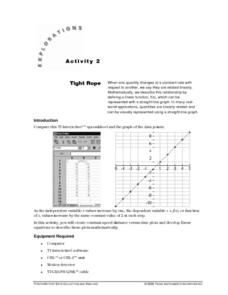
Tight Rope
Learn how to explore the concept of linear functions. In this linear functions lesson, students collect linear data from a motion detector. Students walk to create a linear function. Students plot the points on a graph and determine a...
Curated OER
Logistic Growth
Through the exploration of population growth of a bacteria population, high schoolers learn about and observe bacteria population over a 20 hour period. Students graph the population growth using a scatter plot and discuss its logistic...
Curated OER
Approaching Limits
With the assistance of their Ti-84/Ti-83 Plus calculators, students develop a foundation for the limiting process as well as estimate limits from graphs and tables of values. They view how a function behaves as the input approaches a...
Curated OER
Seeing is Believing: Derivatives
Learn to solve functions by taking the derivatives. In this calculus lesson, students compare the graph of a derivative to that of the original function.
Curated OER
Implicit Differentiation
Pupils explore the concept of derivatives. They use implicit differentiation to determine points on a graph where a tangent line is horizontal, vertical, or oblique. Finally, learners find the derivative of a polynomial by...
Curated OER
Shortest Path
High schoolers explore an application of definite integrals. They graph three functions that go through the same three points. Learners use the symbolic capacity of their calculators to find the shortest path through the three points and...
Curated OER
Quartic Inflection
Learners use their TI-89 calculator to find properties of the quartic polynomials. The instructional activity includes detailed instructions along with screen shots of the graphing calculator display.
Curated OER
Pyramid Activity
Pupils explore the concept of pyramids. They determine if two sides of a pyramid are perpendicular using a graphing calculator, then discuss parallel and perpendicular lines and how to determine if two lines are parallel or...
Curated OER
Exploring Geometry and Algebra using Cabri Jr. Application.
Learners solve geometric problems with algebra and graphing in this lesson. They will prove the bisectors theorem using the Cabri Jr. application, which requires Cabri on their TI.
Curated OER
AP Calculus Exam Prep
Pupils practice sample questions from the AP Calculus Exam. They solve calculus problems involving bounded regions, integration, derivatives, and limits. They then answer free response and multiple choice questions on the above mentioned...
Curated OER
Properties of Logarithms
Learners investigate properties of logarithmic function as they add, subtract and multiply logarithms. They graph and analyze the graph for exponential equivalency.
Curated OER
Piecewise Linear Integral
Young mathematicians solve and graph piecewise functions in this calculus lesson plan. They integrate linear functions containing restrictions and graph their answers using the TI.
Curated OER
Euler's Method Introduction
Young mathematicians define and use Euler's method to solve problems in this calculus instructional activity. Learners visualize graphs and solve differential equations. They create these visuals on the TI calculator.
Curated OER
Comparing Linear and Exponential Functions
Teach your class how to differentiate between linear and exponential functions. They use exponential properties to solve problems, graph them using the TI-Navigator, and make comparisons.


