Curated OER
Meaning of Power
Pupils graph exponential and power functions. In this statistics instructional activity, students test a specific hypotheses and draw conclusion. They use the graph of polynomials to test and draw their conclusions.
Curated OER
Recipe: Unit Rate
Students solve problems using ratios and proportions. In this algebra lesson, students identify the unit rate and convert between fractions and decimals. They create graphs from their data.
Curated OER
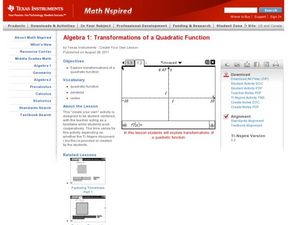
Transformations of a Quadratic Function
Learners graph quadratic functions. In this algebra lesson plan, students perform transformation on the TI calculator as they create a visual. They identify the vertex and intercepts of the parabola.
Curated OER
Perfect Shuffles
Students investigate piecewise functions. In this algebra lesson, students model piecewise functions in the real world. They graph the parts of the functions following the restrictions of the domain.
Curated OER
The Joy of Giving
Children identify wants and needs, bake and sell cookies to raise money, and then go to the mall to purchase gifts for Christmas stockings that are donated to the Salvation Army. They then perform Graphing activities to help children...
Curated OER
Multiplying Inequalities by Negative
Students multiply inequalities by negative. In this algebra lesson, students solve inequalities and graph their solutions on a number line. They pay close attention to the negative consequence, which causes the sign to flip.
Curated OER
Angle-Side Relationships
Learners investigate triangles and their angle-side relationship. In this geometry lesson plan, students identify the property of the triangles and use it to solve the problem correctly. They use the TI to graph their triangles.
Curated OER
Factoring Trinomials
Learners factor trinomials using patterns and their TI to graph their results and make predictions through this lesson. This is accomplished by solving quadratic equations through FOIL and algebra tiles.
Curated OER
Logarithmic Transformations of Data
Students investigate and study logarithmic equations. In this precalculus lesson, students analyze the data behind the function. They define each graph as positive, negative or no correlation. They find the line of best fit.
Curated OER
Probability Distributions
Students collect and plot data on a graph. In this statistics lesson, students analyze the distribution of a sample and predict the outcome. They find the line of best fit and discuss what would make the sample larger.
Curated OER
Center of Mass
Students identify the geometric mean of their data. In this statistics lesson plan, students collect data and graph their findings. They identify the mean, range and mode.
Curated OER
Exploring Infinite Series
Learners analyze geometric series in detail. They determine convergence and sum of geometric series, identify a series that satisfies the alternating series test and utilize a graphing handheld to approximate the sum of a series.
Curated OER
Assessing Normalcy
Students define normal distribution as it relates to the bell curve. In this statistics lesson, students use the central tendencies of mean, median and mode to solve problems. They plot their data and draw conclusion from the graphs.
Curated OER
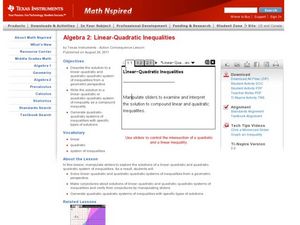
Linear-Quadratic Inequalities
High schoolers graph linear and quadratic functions. In this algebra lesson, students create graph with specific coordinate points. They use the Ti to visualise and differentiate between the two functions.
Curated OER
Pi Day (March 14)
Fourth graders determine the value of ? by measuring the circumference and diameter of circular objects such as soup cans, Oreo cookies, etc..
Curated OER
Give it Back from a Snack
Students conduct and analyze a survey about snacks. In this graphing lesson, students ascertain which snacks would be the best choice for the community. Students hold a sale and decide how the money could best be spent for the school...
Curated OER
LD50 of NaCl to Gammarus spp.
Students learn the meaning of LD50 through lecture and discussion. Through experiment, students graph and calculate the LD50 of salt on fresh water amphipods. Students compare results of the experiment with pesticides and pollutants.
Curated OER
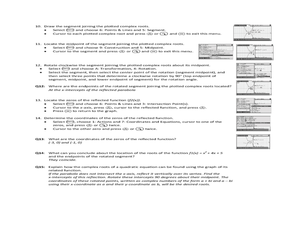
Complex Roots: A Graphical Solution
Using their Ti-Nspire to determine the solutions of parabolas, students explore the concept of complex roots. Students determine if parabolas have real or complex roots. Students determine the the axis of symmetry and the vertex given...
Curated OER
Parabolas
Learn how to evaluate the derivatives of polynomials. Mathematicians find the derivative of a quadratic function and determine the value at a given value. Students compare the slope of the secant line through two points with the...
Curated OER
Corn-Crop is a Bin-Buster
Learners calculate percent change and create lists of data. They enter the corresponding bushels of corn measured in billions to their list and display, then convert the acres into scientific notation and use the value on the home screen...
Curated OER
Properties of Parabolas
Have your learners investigate parabolas. In this Algebra II lesson, students explore the basic definition of a parabola by using Cabri Jr. to create a parabola given the focus and directrix. Students interpret the equation for a...
Curated OER
Hand Sensitivity
Students experiment with the sense of touch. In this tactile lesson, students determine the most sensitive area of the hand. Students experiment by describing objects through touch only. Students compare the amount of sensory data...
Curated OER
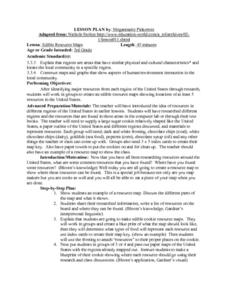
Edible Resource Maps
Third graders work in groups to create an edible resource map showing locations of at least five resources in the United States. Students research on the internet different regions and the resources that are found in those areas. They...
Curated OER
Evaluating the Products of Chords of a Circle
Students investigate chords and make predictions. In this geometry instructional activity, students graph circles and calculate the measurement of each chord. They perform the calculations and make conjectures.


