Concord Consortium
Sum and Product
From linear to quadratic with a simple operation. An exploratory lesson challenges learners to find two linear functions that, when multiplied, produce a given parabola. The task includes the graph of the sum of the functions as well as...
Lake Zurich Community Unit
Inequality Word Problems
This inequality word problems activity is ideal to assess your learners' understanding of inequality and linear concepts around solving and writing equations and inequalities. Equations, graphs and real-life scenarios are used to assure...
Benjamin Franklin High School
Saxon Math: Algebra 2 (Section 3)
In this third of a twelve-part series, the focus moves from using matrices to solving systems of equations with substitution and elimination, including more than two dimensions and variables in equations, and analyzing statistical data....
EngageNY
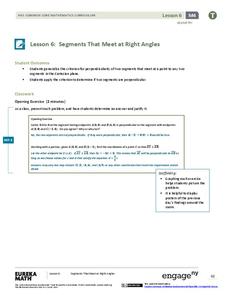
Segments That Meet at Right Angles
Can segments be considered perpendicular if they don't intersect? Learners look at nonintersecting segments on the coordinate plane and make conclusions about the lines that contain those segments. They determine if they are...
Math Drills
Christmas Cartesian Art Holly
Happy Holly Days! Get the class graphing points on a coordinate plane with a worksheet that turns ordered pairs into works of Cartesian art.
EngageNY
Problem Solving and the Coordinate Plane
Class members investigate rectangles on the coordinate plane. They determine the length of line segments in the coordinate plane with the same x-coordinate or same y-coordinate and then solve geometric problems involving perimeter and...
Concord Consortium
All-in-All Problems
Graphs, functions, symbols, and more! Use these strategies to model everything from the flow of a river to the number of cars passing a toll booth. Presented differently but solved similarly, learners consider five different scenarios...
Concord Consortium
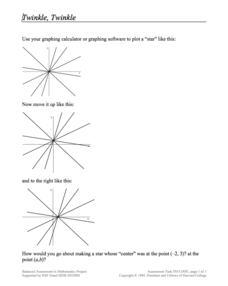
Twinkle, Twinkle
Take a look at a star resource. Young mathematicians use a graphing calculator to draw intersecting lines that look like a star. They then apply translations to move the entire star and also consider what transformations must occur to...
Statistics Education Web
Text Messaging is Time Consuming! What Gives?
The more you text, the less you study. Have classes test this hypothesis or another question related to text messages. Using real data, learners use technology to create a scatter plot and calculate a regression line. They create a dot...
EngageNY
The Opposite of a Number
It's opposite day! The fourth installment of a 21-part module teaches scholars about opposites of integers and of zero. Number lines and real-world situations provide an entry point to this topic.
Kenan Fellows
Let's Move
Find a statistical reason for a fresh start. Using a hypothetical scenario, individuals research statistical data of three different cities. Their goal? Find the best statistical reason for a business to move to a new location. Their...
August House
Why Koala Has a Stumpy Tail
Learn about the animals of Australia with a language arts lesson about an Australian folktale called, Why Koala Has a Stumpy Tail. After reading the story as a class, kids discuss events and characters from the book, retell the story to...
Charleston School District
Pre-Test Unit 4: Linear Funcitons
Let your classes show you what they know! Use this pre-test to assess the current knowledge of your learners. The assessment includes all pre-algebra concepts related to functions: writing and graphing linear relationships, comparing...
Teach Engineering
Applications of Linear Functions
It's not so straightforward — lines can model a variety of applications. Pupils experience linear relationships within the context of science, including Hooke's and Ohm's Laws. Class members got a taste of motion and speed from the...
Balanced Assessment
Books from Andonov
To examine mathematical functions in a modeling situation pupils combine quadratic and step functions to represent a presented scenario. They both graph and write a function to represent data shown in a table.
Kenan Fellows
Man vs. Beast: Approximating Derivatives using Human and Animal Movement
What does dropping a ball look like as a graph? An engaging activity asks learners to record a video of dropping a ball and uploading the video to software for analysis. They compare the position of the ball to time and calculate the...
Concord Consortium
Parameters and Clusters I
Chase the traveling solution. Pupils analyze the solutions to a system of linear equations as the parameter in one equation changes. Scholars then use graphs to illustrate their analyses.
Concord Consortium
Sine Solution
How many times can eager mathematicians catch the waves? Pupils find the solutions of three different trigonometric equations. They then determine the effect of the slope of a line that intersects a trigonometric function and the number...
Curated OER
MAP Practice
In this geometry worksheet, students create circle, line and bar graphs using different comparisons of events. There are 24 questions with an answer key.
MARS, Shell Center, University of Nottingham
Defining Regions Using Inequalities
Your young graphers will collaboratively play their way to a better understanding of the solution set produced by the combining of inequalities. Cooperation and communication are emphasized by the teacher asking questions to guide the...
Houghton Mifflin Harcourt
Nature Walk: English Language Development Lessons (Theme 2)
Walking in nature is the theme of a unit designed to support English language development lessons. Scholars look, write, speak, and move to explore topics such as camping, woodland animals, instruments, bodies of water, things found at a...
Mathematics Assessment Project
Representing Inequalities Graphically
A new, improved version of the game Battleship? Learners graph linear inequalities on the coordinate plane, then participate in a game where they have to guess coordinate points based on the solution to a system of linear inequalities in...
EngageNY
A Surprising Boost from Geometry
Working with imaginary numbers — this is where it gets complex! After exploring the graph of complex numbers, learners simplify them using addition, subtraction, and multiplication.
Curated OER
Less and More Scavenger Hunt
Send your scholars on a measuring scavenger hunt with this interactive worksheet! They use a graphic organizer to record their findings as they search for items which are less than, more than, or just about one inch long. For each, they...
Other popular searches
- Line Graphs
- Double Line Graphs
- Bar and Line Graphs
- Line Pie Bar Graph
- Interpreting Line Graphs
- Line Plot Graphs
- Making Line Graphs
- Reading Line Graphs
- Analyzing Line Graphs
- Creating Line Graphs
- Number Line Graphs
- Reading Double Line Graphs


