Yummy Math
US Holiday Candy Sales
Candy is a big business! Calculate the amount of money consumers spent on major holidays—Easter, Halloween, Christmas, Hanukkah, and Valentine's Day—based on the total amount of candy sales from 2011 and the percentage of each holiday's...
Curated OER
Our Favourite Halloween Treat
Students conduct a survey about Halloween candy and create a bar graph illustrating the data. In this data analysis activity, stud nets are introduced to the topic with a discussion and survey, then the class creates a large graph and...
Curated OER
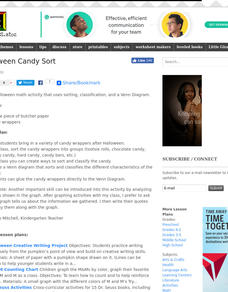
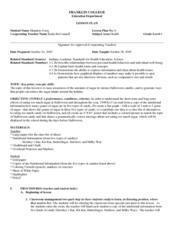
Halloween Candy Sort
Learners use their Halloween candy to practice sorting and classifying. They compete a Venn diagram comparing their candy wrappers. They develop ways as a class to catorgize the candy in different ways.
Curated OER
Halloween Candy/ Sugar Content
Fourth graders examine the amount of sugar contained in Halloween candy by looking at nutritional labels from candy bars. They figure out ways to encourage people to reduce the amount of sugar they eat at this holiday. They look at the...
Curated OER
Halloween Graphitti
Learners complete multi-curricular activities in a Halloween themed lesson. In this Halloween lesson, students examine newspaper ads to find prices of pumpkins and use them to complete a stem and leaf plot. Learners find the diameter,...
Curated OER
Pumpkin Graph
In this Halloween graphing worksheet, 3rd graders graph the number of candies shown on the page. Students cut out and decorate their pumpkin after graphing the 3 types of candy.
Curated OER
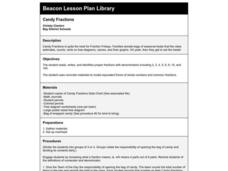
Candy Fractions
Second graders complete math activities with donated seasonal treats. They estimate, count, sort, name and graph bags of treats. They can eat treats when finished.
Curated OER
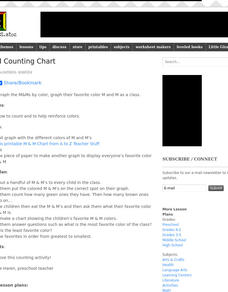
M & M Counting Chart
Students create an individual M&M's graph based on the number of each color of candy pieces in their handful of candy. They graph the favorite color of the whole class while practicing counting and color identification.
Curated OER
Organizing And Reading Data
Students complete three parts of an "Organizning and Reading Data" worksheet. First, they go over the rubric to determine the work will be scored. They organize data by taking tallies, make a pictograph and a bar graph using the data....
Curated OER
Jack-O-Lantern Glyph
Students create a jack-o-lantern glyph that accurately represents his or her answers to a series of questions. The completed jack-o-lanterns are displayed in the classroom and the class interprets the data.


