Inside Mathematics
Party
Thirty at the party won't cost any more than twenty-five. The assessment task provides a scenario for the cost of a party where the initial fee covers a given number of guests. The class determines the cost for specific numbers of guests...
Fredonia State University of New York
Watch Your Step…You May Collide!
Can two lines intersect at more than one point? Using yarn, create two lines on the floor of the classroom to find out. Cooperative groups work through the process of solving systems of equations using task cards and three different...
Mascil Project
Epidemics: Modelling with Mathematics
The Black Death epidemic is responsible for more than one million deaths in the United Kingdom. An inquiry-based activity has young scholars explore the rate of disease spread. They then analyze graphs showing data from epidemics such as...
PBS
Data Plots of Exoplanet Orbital Properties
Scientists discovered the first exoplanet in 1995 and by early 2018, they confirmed the existence of more than 3,700—that's a lot of data! As part of the PBS 9-12 Space series, scholars interpret data about exoplanets. They compare...
Curated OER
Equations and Inequalities
Students in a college algebra class use graphs to solve inequalities. Using the coordinate graphing system, they represent the relationship between x and y intercepts. They practice solving equations with complex numbers and locate...
Curated OER
Using Inequalities to Problem Solve
Students explore inequalities. For this Algebra I lesson, students solve and graph linear inequalities involving addition, subtraction, multiplication, or division. Students use inequalities to solve and graph real-world problems.
Curated OER
Compound Inequalities
Pupils solve problems with compound inequalities. In this algebra instructional activity, students solve inequalities using addition, subtraction, multiplication and division. They graph-their solutions on a numbers line.
Curated OER
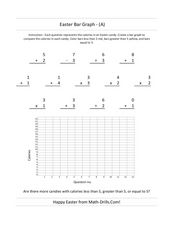
Easter Bar Graph- A
In this Easter math activity, students first solve 13 problems with addition, subtraction, multiplication and division. Using the answers, students make a bar graph.
Curated OER
Easter Bar Graph - (E)
In this math review worksheet, students complete addition, multiplication, division, and subtraction problems where each answer is put into an Easter bar graph. Students complete 13 problems.
Curated OER
Easter Bar Graph - (B)
In this math review worksheet, students complete addition, subtraction, multiplication, and division problems and put their answers into a bar graph that represents calories. Students complete 13 problems and 1 graph.
Curated OER
Graphing Inequalities
In this graphing inequalities worksheet, learners complete 8 inequality tables. Students then graph and shade the 8 inequalities on a coordinate plane.
Curated OER
Linear Inequalities
In this linear inequalities worksheet, students graph and shade 6 linear inequalities. Students then graph and shade 3 absolute value inequalities.
Curated OER
Easter Bar Graph - C
In this math review learning exercise, students complete addition, multiplication, division, and subtraction problems where each answer is inserted into a bar graph. Students complete 13 problems.
Curated OER
Easter Bar Graph - (D)
In this math review worksheet, students complete addition, multiplication, division, and subtraction problems where each answer is put into an Easter bar graph. Students complete 13 problems.
Curated OER
Linear Inequalities
Students imagine that they own a sneaker company. They are asked how they would know if their company made a profit. Students determine the number of sneakers of each type they need to sell in order to "break even." They are asked how...
Curated OER
Graphing Inequalities in Two Variables
In this graphing inequalities instructional activity, 9th graders solve and graph 6 different problems that include two variables. First, they define the given vocabulary terms found at the top of the sheet. Then, students graph each...
Curated OER
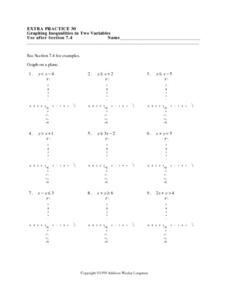
Graphing Inequalities in Two Variables: Extra Practice 30
In this math worksheet, students graph inequalities on a coordinate grid. The eight problems have a coefficient of one for the y variable. Three problems have a negative value for y. The final four problems are horizontal or vertical lines.
Curated OER
Graphing Inequalities in Two Variables
In this graphing inequalities worksheet, students shade 3 inequality problems. Students then graph and shade 4 additional inequalities.
Curated OER
Nine Exercises Identifying Solution Sets to Systems of Inequalities
For this inequality worksheet, students examine graphs of functions and describe the solution set. Explanations and examples are provided. This one-page interactive, multiple choice, worksheet contains nine problems.
Curated OER
Graphing Systems of Inequalities
In this systems of inequalities worksheet, 9th graders solve 10 different sets of problems that include graphing systems of inequalities. First, they graph each inequality separately. Then, students solve each system of inequalities and...
Curated OER
Problem Solving Application: Using a Bar Graph
In this bar graph worksheet, students use a set of 2 bar graphs to answer 6 related questions. Answers are included on page 2. A reference web site is given for additional activities.
Curated OER
Graphing systems of inequalities
In this graphing worksheet, high schoolers graph ten systems of inequalities. Students are then asked to find the area of the regions. A challenge problem is included. where high schoolers are asked to find the volume of the resulting...
Curated OER
Topic 3.4: Graphing Systems of Inequalities
In this inequality worksheet, students graph systems of inequalities. Systems contain two to three equations. A coordinate plane for providing answers is located below each system. This two-page worksheet contains nine problems.
Curated OER
Graphing Linear, Circular, and Parabolic Inequalities
For this graphing worksheet, students are given nine inequalities and then must graph five of their intersections. A grid and cartoon hint are provided.
Other popular searches
- Graphing Linear Inequalities
- Graphing Inequalities
- Math Graphing Inequalities
- Graphing Compound Inequalities
- Algebra Graphing Inequalities


