Curated OER
Interpreting Graphs: Temperate Climates
In this interpreting graphs worksheet, learners read a graph containing data of rainfall and temperature, then complete 18 questions, interpreting the data.
Curated OER
Which Graphs are Functions?
In this graphing worksheet, students use the vertical line test to determine if graphs are functions. This two-page worksheet contains 8 problems.
Curated OER
Absolute Value Equations and Inequalities
In this algebra instructional activity, students solve equations and inequalities. They graph their solution set on a number line. There are 16 questions with an answer key.
Curated OER
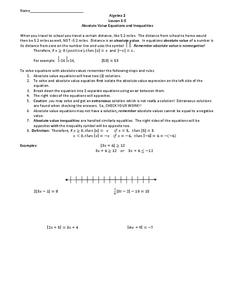
Absolute Value Equations and Inequalities
In this Algebra II activity, 11th graders solve and graph the solutions to absolute value equations and inequalities. The two page activity provides explanation and examples in addition to sixteen practice questions. Answers are not...
Curated OER
Solving Inequalities with Fractional Coefficients
For this algebra worksheet, learners solve inequalities by factoring. They graph their solution on a number line. There is an answer key.
Curated OER
Multiplying Inequalities by Negative
Students multiply inequalities by negative. In this algebra lesson, students solve inequalities and graph their solutions on a number line. They pay close attention to the negative consequence, which causes the sign to flip.
Curated OER
Unit 4: Worksheet 4: Functions and Graphs
In this function and graph activity, students read and interpret maps and graphs. They write an equation, define variables and solve the equation. Students solve diamond problems and use the distributive property to solve equations. ...
Curated OER
Graphs and Spreadsheets
Students collect data and present it in a graph and/or a spreadsheet, depending on their previous understanding of technology.
Curated OER
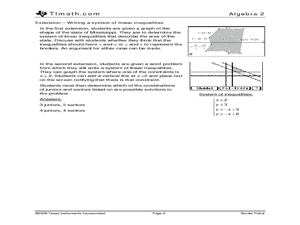
Border Patrol
Young scholars investigate systems of linear inequalities as they apply to an area of land. They practice graphing systems and determine if a point lies in the solution.
Curated OER
Functions of Algebra
Students use technology graph and evaluate linear inequalities. They write and manipulate inequalities for use on a graphing calculator. In addition they apply their skills to analyze inequalities. Answer Key included.
Curated OER
Investigating Parabolas
In this investigating parabolas worksheet, 9th graders solve and graph 7 different problems that include graphing various equations that represent parabolas. First, they sketch their graphs to each problem. Then, students determine what...
Curated OER
Algebra 2 Test
In this algebra worksheet, students solve problems by graphing inequalities, finding the slope of a line and identifying functions. This is a review of chapter 2 on an algebra test. There are 21 questions.
Pennsylvania Department of Education
Use Order of Operations to Evaluate Expressions—No Grouping Symbols
Students identify and explain different types of data collection and graphs. For this graphs and data collection lesson, students record their observations of a variety of data collection tools and graphs displayed in the room. Students...
Curated OER
M & M Madness
Students work with the mathematics unit of collection, organization, and presentation of data. In this math and technology lesson plan, students use Valentine M & M’s and The Graph Club to sort and graph the various colored M & M’s.
Curated OER
Earth Energy Budget Pre Lab
Students explore energy by conducting an in class experiment. In this climate change lesson, students conduct a water vapor experiment in a soda bottle. Students utilize graphs and charts to analyze the results of the experiment and help...
Pennsylvania Department of Education
Equal Groups
Students explore statistics by completing a graphing activity. In this data analysis lesson, students define a list of mathematical vocabulary terms before unpacking a box of raisins. Students utilize the raisins to plot data on a line...
Curated OER
Graphing Inequalities
In this graphing inequalities worksheet, 6th graders solve and complete 24 different types of problems. First, they draw a graph for each given inequality. Then, students solve for each equation.
Curated OER
Linear Inequalities
Ninth graders explore solving linear inequalities. They discuss vocabulary words and symbols associated with linear inequalities. After a demonstration by the teacher, 9th graders solve and graph inequalities. Students complete a...
Curated OER
Graphing Inequalities
In this graphing inequalities worksheet, students create graphs of algebraic expressions containing inequalities. This two-page worksheet contains explanations and examples prior to the exercise. The first page is a contains...
Curated OER
Graphs, Equations and Inequalities
In this inequalities worksheet, 6th graders solve and complete 30 various types of problems. First, they calculate and write down a whole number for each equation. Then, students determine the gradient of a line with a given equation....
Curated OER
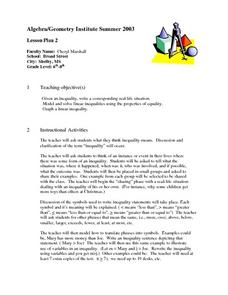
Lesson Plan 2: Linear Inequalities
Students investigate linear inequalities and the associated symbols. After a teacher demonstration, they translate given phrases into symbols. Students solve and graph solutions to linear inequalities. Using newspapers, they locate...
Curated OER
Bar Graphs
Seventh graders visually represent and analyze data using a frequency table. They recognize what values in a data set are bigger by looking at a bar graph and answer questions about certain bar graphs and what they represent. Students...
Curated OER
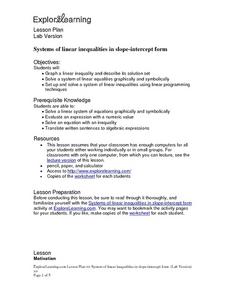
Systems of linear inequalities in slope-intercept form
Students graph a linear inequality and describe its solution set. They solve a system of linear equalities graphically and symbolically. Students set up and solve a system of linear inequalities using linear programming techniques. ...
5280 Math
Capture the Points
Play a game of capture the points. Young scholars receive a number line with specific points graphed and must write an inequality that captures all the points. The second task of the algebra project is to write an inequality with...
Other popular searches
- Graphing Linear Inequalities
- Graphing Inequalities
- Linear Inequalities Graph
- Graph Inequalities
- Combined Inequalities Graph
- Graph Quadratic Inequalities
- Math Graphing Inequalities
- Graphing Compound Inequalities
- Graph System of Inequalities
- Solve and Graph Inequalities
- Algebra Graphing Inequalities


