Curated OER
Equations and Inequalities
In this equations and inequalities worksheet, 9th graders solve and complete 2 multiple choice problems. First, they read and identify the graph shown representing a given equation. Then, students determine the graph that best represents...
Lane Community College
Review Sheets: Beginning Algebra
This jumbo worksheet contains everything you need to get through Pre-Algebra. Begin with simple expressions, and end with linear functions and polygons. There are multiple problems for each topic to make sure those skills are set.
Curated OER
Analyzing Graphs
For this statistics and probability worksheet, students analyze frequency distribution tables or histograms and box and whisker plots. The two page worksheet contains four multiple choice questions. Answers are included.
Curated OER
Inequalities
Seventh graders graph solutions for inequalities on a number line. They solve 1 and 2 step inequalities in one variable. Students also check solutions to 1 and 2 step equations in one variable
Curated OER
Graphing Linear Inequalities
In this algebra worksheet, students graph inequality linear graphs and shade using a test point. There are 14 problems with an answer key.
Curated OER
Inequalities lesson 4
Seventh graders graph solutions for inequalities on a number line. They solve problems combining like terms inequalities in one variable. Students check solutions to combining like terms inequalities in one variable.
Curated OER
Linear Inequality
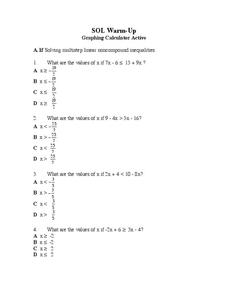
Seventh graders solve and complete 12 different problems that include graphing and using multi-steps to solve. First, they solve each multi-step linear non-compound inequality with the given values. Then, pupils graph each solution given...
Virginia Department of Education
Transformationally Speaking
Young mathematicians explore transformations of graphs by graphing sets of functions on the same pair of axes. They use their graphs to determine the effect that the values of a and b in y = ax + b have on the graph of y = x.
Curated OER
Mat 0024 Section 1.4: Signed Numbers and Decimals
This activity has a little of everything. Compare fractions, determine if numbers are less than, greater than, or equal to. Then practice lining up the decimals to add and subtract decimal numbers. Then multiply decimals remembering to...
Tech Know Teaching
6th Grade Constructed Response Question
Graphs, charts, maps, diagrams. Reading and comprehending informational text is far more than just decoding the words on a page. Here's a packet that provides young readers with practice answering constructed response questions using...
University of Colorado
The Moons of Jupiter
Can you name the three planets with rings in our solar system? Everyone knows Saturn, many know Uranus, but most people are surprised to learn that Jupiter also has a ring. The third in a series of six teaches pupils what is around...
Chicago Botanic Garden
Historical Climate Cycles
Ice core samples give scientists access to climates of old—those from more than 800,000 years ago. Through an analysis of various temperature graphs from ice cores, tree rings, and weather stations, scholars compare historical climates...
CK-12 Foundation
Cliff Diver
Cliff diving is more than an adrenaline rush ... it's a lesson in physics! Scholars adjust the height of a cliff and plot the resulting velocity and position over time on graphs. They also can incorporate air resistance to monitor the...
CK-12 Foundation
Types of Data Representation: Baby Due Date Histogram
Histograms are likely to give birth to a variety of conclusions. Given the likelihood a woman is to give birth after a certain number of weeks, pupils create a histogram. The scholars use the histogram to analyze the data and answer...
PBS
Light Curves of Kepler's First Five Discoveries
The Kepler missions discovered and confirmed more than 2,650 exoplanets to date. A video shares the data from the first five discoveries. It provides graphs and diagrams to put each discovery in perspective to help scholars discuss the...
CK-12 Foundation
See Saw
Can a mother who weighs five times more than her child really be held in the air on a see saw by the child? A simple simulation demonstrates how this is possible through altering the distance from the fulcrum. Scholars can adjust the...
Curated OER
Graphing Linear Inequalities
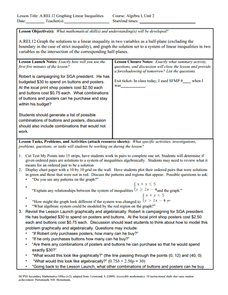
Eighth graders extend skills for representing and solving linear equations to linear inequalities. Lesson activities build understanding and skill by plotting ordered pairs of numbers that either satisfy or do not satisfy a given...
Curated OER
Linear Programming and the Inequalz App
Learners graph system of linear inequalities in this lesson. Your class will use the Inequality Graphing App to enter linear programming functions into the calculator that can be stored for later use. They then determine the maximum for...
Curated OER
Mr. Brown's Pet Store
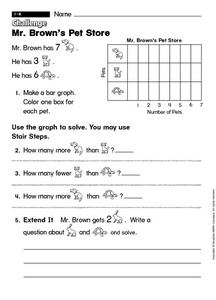
For this early childhood problem solving worksheet, students make a bar graph with the provided information and then use the graph to solve 4 problems.
Curated OER
Balanced Or Unbalanced
Students use physical models and graphs in order to solve problems that have their origin in the real world that require algebraic thinking. The words are changed into equations and inequalities in order to be solved. This requires...
Curated OER
Integrated Algebra: State Exam
In this integrated algebra worksheet, students solve problems related to topics covered in algebra for the entire year. Topics include, but are not limited to, inequalities, probability, functions, interval notation, exploring graphs,...
Curated OER
Integrated Algebra Final Exam
In this integrated algebra worksheet, students solve problems involving system of equations, quadratic equations, inequalities, surface area, and radicals. This 28-page worksheet contains 39 multi-step problems.
Curated OER
Math for Fourth Grade: Statistical Charts
In this math for fourth grade statistical charts worksheet, 4th graders answer 7 multiple choice questions in standardized test format about data, charts and graphs.
Curated OER
Solving Quadratic Systems
In this solving quadratic systems worksheet, 11th graders solve 8 different problems. First, they solve each system of equations algebraically. Then, students solve each system of inequalities by graphing on the grids provided for each...
Other popular searches
- Graphing Linear Inequalities
- Graphing Inequalities
- Linear Inequalities Graph
- Graph Inequalities
- Combined Inequalities Graph
- Graph Quadratic Inequalities
- Math Graphing Inequalities
- Graphing Compound Inequalities
- Graph System of Inequalities
- Solve and Graph Inequalities
- Algebra Graphing Inequalities


