Curated OER
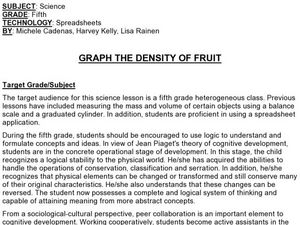
Graph the Density of Fruit
Fifth graders review the definition of mass and volume. They calculate and graph the density of various types of fruit while working in groups on a spreadsheet program. They look at how size of the fruit can be similar but the weight is...
Curated OER
Solution Sets
In this solution set worksheet, 9th graders solve 5 different problems that include graphing on the x- and y-axis. First, they solve each inequality as needed. Then, students graph the solution set found in each on the coordinate plane...
Curated OER
Apple Graph
In this apple graph activity, students survey their classmates to see what type of apple they enjoy eating the most. Students graph their data.
Curated OER
Algebra II: Chapter 7 Test - Systems of Equations
In this systems of equations worksheet, students solve systems of equations, systems of inequalities, and linear equations. They read word problems and write a system of equations that depicts the problem. this two-page...
Curated OER
Curve Fitting and the TI-85 Calculator
Seventh graders follow a step-by-step guide for using graphing calculator to determine equations which best fit data graphed. They gather data from various sites on the web, or they do searches to find information necessary to complete...
Curated OER
Histograms: Homework
In this histograms worksheet, students learn how to make a histogram. Students give graphs a title, draw the axes, label the vertical axis, choose an appropriate scale, and mark equal intervals. Students label the horizontal axis with...
Curated OER
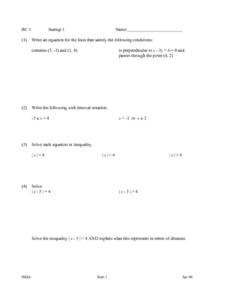
Startup 1: Functions & Interval Notation
In this function worksheet, students write an equation of a line. They solve inequalities and write functions with interval notation. This two-page worksheet contains approximately 20 problems.
Curated OER
Lesson 2: The Quadratic Equation
Students graph quadratic equations. They use interactive graphs, on CD-ROM, to answer specific equations. Students identify the vertex of a parabola and the axis of symmetry.
Curated OER
Favorite Animals
In this graphing worksheet, students read and answer questions about a picture graph showing the favorite animals of a group of children
Curated OER
Unit 12 - Version 6.0 - Worksheet 1 - Inequality
In this inequality worksheet, students solve inequality equations and graph the solution on a number line. They add and subtract fractions with variables and unlike denominators. Students solve absolute variable equations with one...
Curated OER
Tallies Tell It All
Students explore data collection through the use of tally marks. After a demonstration of the use of tally marks students complete various inquires where they create a chart documenting the number of times a desired result happens. They...
Curated OER
Compound Inequalitites
Students graph compound inequalities. In this algebra instructional activity, students solve equations with inequalities and graph the results on a number line. They distinguish between "or" and "and"
Curated OER
Inequalitities Mixed Review
Learners solve inequalities and graph it on a number line. In this algebra activity, students rewrite word problems into algebraic equations and graph it using compound inequalities.
Curated OER
Use the Grid to Answer the Questions
In this algebra activity, students identify the points on a graph and make sure the lines satisfy the conditions placed on the values.
Curated OER
Cinco De Mayo
High schoolers make a graph identifying the immigration of Mexicans to the US. In this algebra lesson, students practice graphing as they review different trends in immigration over the past 100 years. They interpret and analyze their...
Curated OER
Chapter 24: Pure Monopoly
Monopoly is more than a game in this presentation, which explores the characteristics of four different market models. Representing the concept of a monopolistic economy in both charts and graphs, the information in these slides can be...
PBS
U.S. Agricultural Subsidies and Nutrition
Most young people don't spend a lot of time thinking about why some foods cost less than others. This resource uses clips from the documentary, Food, Inc. to explore the impact of agricultural subsidies on nutrition, health, and the...
Illustrative Mathematics
How Many _______ Are In. . . ?
Help your learners gain meaningful understanding of dividing fractions using fraction models. The activity includes nine problems which are sequenced to show how the fraction division algorithm evolves. Have students use graph paper or...
Bowland
Explorers – Patrol Services
Far out — plan a trip to space! Aspiring mathematicians steer a space vehicle through an asteroid field, calculate currency exchanges to buy provisions, and determine placement of charges to blow up asteroids. Along the way, they learn...
CK-12 Foundation
Archery
Archery is believed to be one of the oldest sports in the world at more than 25,000 years old—meaning it can teach your classes a lot! Scholars learn about the forces interacting in the archery simulation. They control the archer's...
CK-12 Foundation
Block and Tackle
Can you easily lift more than your own weight? With a pulley system, almost anyone can manage this challenge. Scholars adjust the mechanical advantage (number of pulleys), weight of object being lifted, and the length of rope pulled. The...
CK-12 Foundation
Newton's Cannon
Gravity does more than keep our feet on the ground — it holds a satellite in orbit, too. Help learners understand the effects of gravity on an orbiting object through a simulation activity. Individuals adjust a launch speed and watch as...
Centers for Disease Control and Prevention
Major Disparities in Adult Cigarette Smoking Exist Among and Within Racial and Ethnic Groups
Data indicates that some racial groups smoke more than others, and that with that racial group, there are smaller groups whose smoking habits vary as well. Secondary learners read a graph that details the differences between the Asian...
Concord Consortium
Gestation and Longevity
Is the gestation length of an animal a predictor of the average life expectancy of that animal? Learners analyze similar data for more than 50 different animals. They choose a data display and draw conclusions from their graphs.
Other popular searches
- Graphing Linear Inequalities
- Graphing Inequalities
- Linear Inequalities Graph
- Graph Inequalities
- Combined Inequalities Graph
- Graph Quadratic Inequalities
- Math Graphing Inequalities
- Graphing Compound Inequalities
- Graph System of Inequalities
- Solve and Graph Inequalities
- Algebra Graphing Inequalities


