Curated OER
Iterating the Function over Real Numbers
Young scholars use a spreadsheet to find sequences of numbers. In this algebra lesson, students find the values for c of a quadratic written in standard form. They relate the behavior of the graph to the values of the equation.
Curated OER
Area of Combined Shapes - Turtle Combo
Students graph polygons using the name and number of sides. In this geometry lesson, students identify the formula to calculate the area and perimeter of polygons. They relate the formula to different polygons and shapes.
Curated OER
Math Morphing Proximate and Evolutionary Mechanisms
Students identify the different types of fractals. In this geometry lesson, students use math to analyze different biological phenomena. They collect data from the experiments and construct graphs.
Computer Science Unplugged
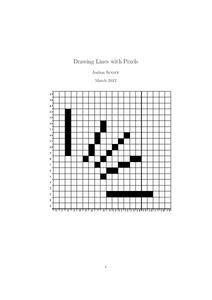
Drawing Lines with Pixels
How do the computers keep it straight? Using the provided algorithms, class members draw a line and a circle using pixels. They then check the drawings using a straight edge and compass to determine the accuracy of their drawings.
Curated OER
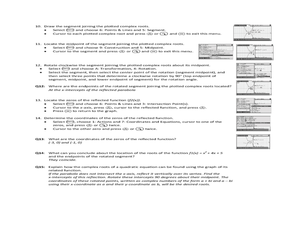
Complex Roots: A Graphical Solution
Using their Ti-Nspire to determine the solutions of parabolas, students explore the concept of complex roots. Students determine if parabolas have real or complex roots. Students determine the the axis of symmetry and the vertex given...
Curated OER
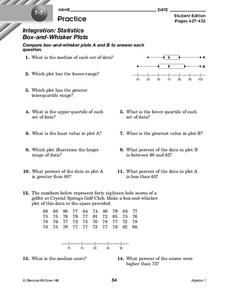
Box-and-Whisker Plots
In this box-and-whisker plots worksheet, 9th graders solve and complete 14 different problems that include comparing various box-and-whisker plots. First, they determine the median for each set of data and plot the lesser range. Then,...
Curated OER
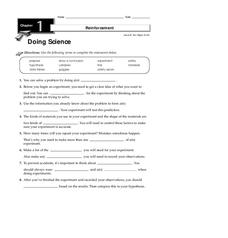
Doing Science
In this science experiment process worksheet, students will learn about the steps of conducting a science experiment, including creating a hypothesis, collecting data and drawing a conclusion. This worksheet has 8 fill in the blank...
Curated OER
Measures of Central Tendency
For this measures of central tendency worksheet, students solve and complete 6 different problems. First, they count the number of items in each set of data. Then, students determine the mean, median and mode for each. In addition, they...
Curated OER
Leveled Problem Solving: Histograms
In this using data, frequency table, and histogram to solve word problems worksheet, students solve problems about prices of toys and numbers of toys sold to solve consumer mathematics problems. Students solve six problems.
Curated OER
comparison of Two Gender Sports Teams
Students gather data on sports team and create a box and whisper plot. In this data collection instructional activity, students find the median, the quartile range, and relationships between variables.
Pennsylvania Department of Education
Freckle Face
Students collect and record data. In this early data analysis lesson, students gather data about their partners face. As a class, the students use tally marks and pictographs to record the data and answer question about the information...
Curated OER
Frequency Tables and Stem-and-Leaf Plots
Students are introduced to the function of frequency tables and stem and leaf plots. In groups, they determine the frequency of their teacher coughing, ringing a bell or raising their hand. To end the lesson, they determine frequency...
Curated OER
Track Meet
In this reasoning worksheet, 3rd graders look over a table with statistics and solve the answers to 5 word problems related to the table about a class track meet.
Curated OER
Discussion Sheet 1: Domain & Range of a Function
In this domain and range instructional activity, students solve inequalities, determine the domain and range for a function, identify the limits, and sketch graphs of a function. This two-page instructional activity contains nine...
Curated OER
Limits with a Calculator
Students investigate Limits using a graphing calculator or TI. In this calculus lesson, students solve limit problems through modeling and relation to the real world. They use correct notation and solve problems involving more than one...
Curated OER
Constructing and Solving Linear Equations
Students solve linear equations In this algebra lesson, students create linear equations using integer coefficients greater than one. They graph their solution on a coordinate plane.
Curated OER
Pictures of Data
In this data worksheet, students look at maps and charts and answer multiple choice questions about them. Students complete 10 questions.
Curated OER
Problem-Solving Decisions: Choose the Operation: Problem Solving
In this math operations worksheet, students solve the word problem using the pie chart and following the steps of understand, plan, solve, and look back. Students then answer a final question by choosing the operation and solving.
Curated OER
Data Analysis Self-Test
In this data analysis worksheet, students complete 1 problem that has 7 parts involving mean, median, mode, range, and quartiles. Students then perform 5 operations with matrices.
Curated OER
Integrated Algebra Practice: Histograms
In this histogram learning exercise, students solve 6 multiple choice and short answer problems. Students read histograms and determine the frequency of a particular item.
Curated OER
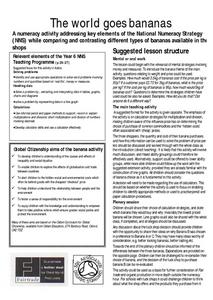
The World Goes Bananas
Learners comprehend the causes and effects of inequality and social injustice. They explore the effects of globalization and trade between countries. Students discuss the hidden social and environmental costs which often lie behind goods...
Curated OER
Cause and Effect
Third graders investigate cause and effect. In this cause and effect lesson, 3rd graders read a story and determine what are the causes and effects. Students match sentence strips to the make the correct cause and effect sentence....
Curated OER
Pictograms of Haircuts
In this math worksheet, students convert the data into numbers from the pictograms. The graphic organizer gives information for the 8 follow up questions.
Curated OER
You Need How Much Food When? Where?
Ninth graders explore how human activities shape the earth's surface. In this awareness lesson, 9th graders create pictographs showing the relations of food, people, land, and resources. Students complete worksheet.
Other popular searches
- Graphing Linear Inequalities
- Graphing Inequalities
- Linear Inequalities Graph
- Graph Inequalities
- Combined Inequalities Graph
- Graph Quadratic Inequalities
- Math Graphing Inequalities
- Graphing Compound Inequalities
- Graph System of Inequalities
- Solve and Graph Inequalities
- Algebra Graphing Inequalities


