Curated OER
Graph Linear Inequalities
Int his algebra instructional activity, 11th graders solve linear inequalities using algebra and graph their solution on a graph. They analyze graphs and write an equation for the inequality. There are 4 questions with an answer key.
Curated OER
Linear Inequalities
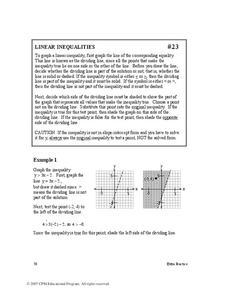
In this linear inequalities worksheet, students solve and graph systems of inequalities on a coordinate plane. Examples and explanations are provided. This five-page worksheet contains 32 problems. Answers are provided at the end of...
Curated OER
Quadratic Inequalities
In this quadratic inequalities worksheet, 9th graders solve and graph 10 different problems that include various forms of inequalities. First, they solve each equation shown algebraically. Then, students state the solution set of the...
Curated OER
Absolute Value Inequalities
In this absolute value inequalities worksheet, students solve given inequalities and graph their solution. This four-page worksheet contains 26 problems. Answers are provided on the last two pages.
Curated OER
Solving Two-Step Inequalities
In this inequalities worksheet, learners use two steps to solve 16 inequality problems. A line graph is provided to graph the answers, and an answer key is provided.
Curated OER
Graphing Systems of Inequalities
In this graphing systems of inequalities worksheet, 9th graders solve and complete 8 different problems. First, they solve each inequality if necessary. Then, students graph each inequality to locate the overlapping portions on the grid....
Curated OER
Solving Multi-Step Inequalities
In this inequalities worksheet, students solve inequalities. They graph solutions on a number line. Students solve problems by combining like terms, and using the distributive property. Variables appear on both sides of the...
Curated OER
Inequalities and Measures of Central Tendency
In this inequality and measures of central tendency worksheet, students solve and graph linear inequalities. They organize given data to identify the mean, mode and range. Students interpret box-and-whisker plots. This three-page...
Curated OER
Multi-Step Inequalities
In this multi-step inequalities activity, students solve inequalities for the unknown. They graph the solution on a number line. This four-page activity contains 24 multi-step problems. Answers are provided on the last page.
Curated OER
Equations and Inequalities
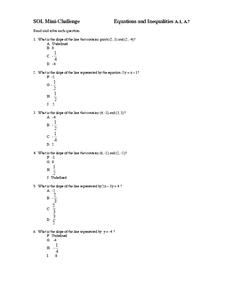
In this equations and inequalities learning exercise, 9th graders solve and graph 10 different problems that include determining the slope of a line in each. First, they determine the line that contains given points on a grid. Then,...
Curated OER
One-Step Inequalities
In this one-step inequality worksheet, students solve given inequality equations and graph the solution on a number line. This four-page worksheet contains 24 problems. Answers are provided on the last two pages.
Curated OER
Learning to Make Line Graphs
Students analyze data and create a line graph. In this graphing lesson, students explore data from a previous experiment and plot the information on a line graph. Students analyze their findings.
Curated OER
M&M Graphing and Probability
Students sort, classify, and graph M & M's. They create pictographs and bar graphs with the colors and numbers in each bag of M & M's. They calculate the ratio and probability based on class results.
Curated OER
Graphing with Stems-and -Leafs
Fourth graders examine the use of stem and leaf graphs. For this stem and leaf graph lesson, 4th graders participate in teacher led lesson showing the use of the graphs. They work in groups to collect data about peanuts before making a...
Curated OER
Spaghetti Graphs
Learners work in pairs to test the strength of spaghetti strands. They collect and graph data to determine a line of best fit. Students create a linear equation to interpret their data. Based on the data collected, learners predict...
Curated OER
Solving Inequalities
In this inequalities worksheet, learners solve and graph inequalities. They shade the answer region. Explanations and examples are provided at the beginning of the document. Answers are at the end of the worksheet. This four-page...
Curated OER
Cosmic Bar Graphs
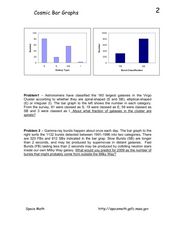
In this cosmic bar graph worksheet, students solve 2 problems using given bar graphs that plot the number of galaxies vs. the galaxy type and the number of gamma-ray bursts vs. the burst classification. Students find the fraction of...
Curated OER
Functions and Graphing
Graphing functions in a real world application makes math come to life. Learners graph points on a coordinate plane and identify various points on a graph by working through a set of real world problems. This is a perfect review exercise.
Curated OER
Graphs to Represent a Data Set
Here are the number of animals Jackson saw at the zoo; scholars organize data into bar graphs using this worksheet. Encourage labeling, but consider having scholars do these on another sheet because there isn't room for the x-axis to be...
Curated OER
Graphing Linear Equations Cards
OK, so maybe graphing linear equations can be fun. This activity includes a set of linear equation cards to be cut and place face up on a table. Learners pick a card and match it to the correct graph card. This is a really fun way to...
Raytheon
Inequalities and Systems
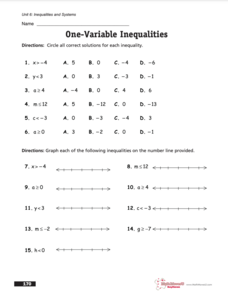
For this one variable inequalities worksheet, middle schoolers circle the correct solutions, complete graphing problems, and solve for the variables. Students complete 37 problems.
Curated OER
Graphing Inequalities
Students solve inequalities and graph. In this algebra lesson, students rewrite inequalities in the slope intercept form and graph using the slope and intercept. They shade the correct side of the line using greater than or less than as...
Curated OER
Graphs, Equations and Inequalities
In this graphs, equations and inequalities worksheet, high schoolers graph inequalities. They read graphs and interpret them. Students draw curves with equations. This 12 page worksheet contains approximately 70 problems. Answers are...
Curated OER
Graphing Inequalities in One Variable
Students graph inequalities on a number line. In this algebra lesson plan, students solve linear and compound inequalities and graph them on a number line. They write an inequality given the number line with the solution on it.
Other popular searches
- Graphing Linear Inequalities
- Graphing Inequalities
- Linear Inequalities Graph
- Graph Inequalities
- Combined Inequalities Graph
- Graph Quadratic Inequalities
- Math Graphing Inequalities
- Graphing Compound Inequalities
- Graph System of Inequalities
- Solve and Graph Inequalities
- Algebra Graphing Inequalities


