Curated OER
Graphs
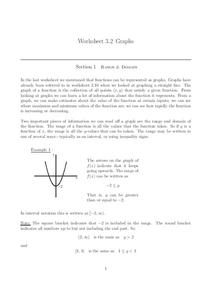
In this graphs worksheet, students solve and complete 15 various types of problems. First, they determine the range of the function of the graph shown and write in interval notation. Then, students find the domain of the function in the...
Inside Mathematics
Graphs (2007)
Challenge the class to utilize their knowledge of linear and quadratic functions to determine the intersection of the parent quadratic graph and linear proportional graphs. Using the pattern for the solutions, individuals develop a...
Curated OER
Inequalities in Two Variables
In this algebra worksheet, students solve and graph 3 linear inequalities on coordinate systems. They solve and graph 3 systems of linear inequalities on a coordinate grid.
Curated OER
Graphing Inequalities
In this graphing inequalities worksheet, students solve and graph 10 different problems that include various inequalities. First, they study each of the examples given. Then, students graph the remaining equalities and inequalities as...
Curated OER
Intersections, Unions, and Compound Inequalities
In this algebra worksheet, students graph inequalities on number lines. Two problems are written in interval notation. The other five problems require students to graph and then write in interval notation.
Curated OER
College Prep Algebra, Inequalities
In this algebra worksheet, students solve and graph 10 linear inequalities. Students must remember to alter the inequality when the negative sign is on the variable.
Curated OER
Math--Pictures and Bars--Learning About Graphs
What is a graph? What does it tell us? How do you make one? These are all questions that are answered in the included packet. It's a great introduction to graphing for young learners!
Curated OER
Topic 1.7 - Solving Absolute Value Inequalities
In this algebra worksheet, learners solve one variable inequalities, compound inequalities, and absolute value inequalities and then graph the solution set. There are 10 problems to solve on this worksheet.
Curated OER
Choose a Graph to Display Data
In this math graphs worksheet, students write line plot, tally chart, pictograph, or bar graph to tell the best kind of graph to use to answer the six questions.
Willow Tree
Solving Inequalities
What does solving an inequality have in common with solving an equation? Almost everything! A math resource focuses on the one exception. The examples lead learners through the steps of solving an equality when multiplying or dividing by...
Flipped Math
Solve Inequalities
One solves inequalities just like equations ... well, almost. Pupils watch a video lecture on solving linear inequalities. They practice solving inequalities, check their answers with the video, and continue to practice the concept with...
Virginia Department of Education
Graphing Systems of Inequalities
Apply systems of inequalities to a real-world problem. Here, scholars learn to graph solutions to systems of linear inequalities. To finish the lesson, they solve a problem involving burgers and cheeseburgers using a system of inequalities.
Virginia Department of Education
Inequalities
Compare graphing an inequality in one variable on a number line to graphing an inequality in two variables on a coordinate plane. Young mathematicians work on a puzzle matching inequalities and their solutions. They then complete a...
EngageNY
Writing and Graphing Inequalities in Real-World Problems
Inequalities: when one solution just doesn't suffice. Individuals learn to write inequalities in real-world contexts and graph solution sets on the number line. All inequalities in the lesson are of the form x < c or x < c.
Kuta Software
One-Step Inequalities
Here's a simple worksheet on solving and graphing inequalities for your algebra class. Learners solve 24 questions, graphing each on a number line. Numbers include fractions, integers, and negative numbers.
MARS, Shell Center, University of Nottingham
Defining Regions Using Inequalities
Your young graphers will collaboratively play their way to a better understanding of the solution set produced by the combining of inequalities. Cooperation and communication are emphasized by the teacher asking questions to guide the...
EngageNY
Perimeter and Area of Polygonal Regions Defined by Systems of Inequalities
When algebra and geometry get together, good things happen! Given a system of inequalities that create a quadrilateral, learners graph and find vertices. They then use the vertices and Green's Theorem to find the area and perimeter of...
Math Worksheets 4 Kids
Graph Using Number Line
In this algebra activity, students solve linear inequalities and graph their solution on a number line using the inequality signs correctly. There are 5 questions with an answer key.
Curated OER
Nonlinear Inequalities
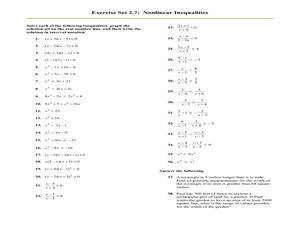
In this Algebra II worksheet, 11th graders solve nonlinear inequalities, graph the solution set on the number line, and write the solution in interval notation. The one page worksheet contains thirty-eight problems. Answers are provided.
Curated OER
Inequalities and Their Graphs
In this inequalities and graphs learning exercise, students draw graphs for given inequalities. They identify less than, greater than, less than or equal to and greater than or equal to. Students write inequalities for given graphs. This...
Curated OER
Graphing Linear Inequalities
In this Algebra I worksheet, 9th graders graph the solution of the given linear inequalities. The two page worksheet contains twelve problems. Solution key is provided.
Lake Zurich Community Unit
Inequality Word Problems
This inequality word problems activity is ideal to assess your learners' understanding of inequality and linear concepts around solving and writing equations and inequalities. Equations, graphs and real-life scenarios are used to assure...
Flipped Math
Unit 2 Review: Create and Solve Equations and Inequalities
Start with the basics. Pupils work through a review of the unit on equations and inequalities. Learners begin with solving equations and inequalities with no context, move on to problems that involve a context, and finish with a...
Balanced Assessment
Bathtub Graph
Represent the relationship between independent and dependent variables through a modeling situation. The activity expects learners to graph the volume of water in a bathtub during a given scenario. The graph should result in two areas of...
Other popular searches
- Graphing Linear Inequalities
- Graphing Inequalities
- Math Graphing Inequalities
- Graphing Compound Inequalities
- Algebra Graphing Inequalities


