West Contra Costa Unified School District
Evaluating Functions
Functions as inputs for other functions? After reviewing function notation and how to input values to evaluate functions, class members input functions into functions, essentially determining the composition of functions.
EngageNY
Graphs Can Solve Equations Too
There are many equations Algebra I students are not ready to solve. Graphing to solve gives them a strategy to use when they are unsure of an algebraic approach to solve the problem. The lesson exposes learners to a wide variety of...
Curated OER
Model and Solve Algebraic Equations
Examine multiple ways to solve algebraic equations. Pupils will generate a problem solving strategy that addresses the prompt given by the teacher. They will then share their problem solving strategy with the class. Graphic organizers,...
EngageNY
Comparing Rational Expressions
Introduce a new type of function through discovery. Math learners build an understanding of rational expressions by creating tables and graphing the result.
Curated OER
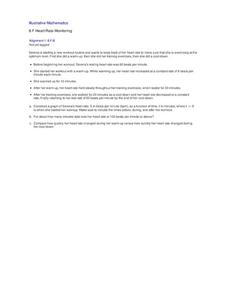
Heart Rate Monitoring
Algebra learners like this resource because it is easy to understand and it relates to their lives. Whether you are starting a new workout routine, or just climbing the stairs, your heart rate increases and decreases throughout the day....
Mathematics Vision Project
More Functions, More Features
Learners tackle a wide range of intimidating topics in this comprehensive unit that spans piecewise functions, absolute value of functions, and inverse functions (among other topics). Investigative group work alternates with more...
Curated OER
A Sum of Functions
Collaborative learners will see the geometric addition of functions by graphing the sum of two graphed curves on the same coordinate plane. This task then naturally flows into giving learners the algebraic representation of the curves...
Curated OER
What's My Function?
Fifth graders utilize input/output tables to help them solve algebraic equations. They incorporate patterns, number sequences and relations to represent and analyze mathematical problems and number relationships using algebraic symbols.
Shodor Education Foundation
Graph Sketcher
Sketch graphs with the Graph Sketcher. Scholars graph functions on a coordinate plane. An interactive makes it as easy as inputting the function and clicking a button.
Houghton Mifflin Harcourt
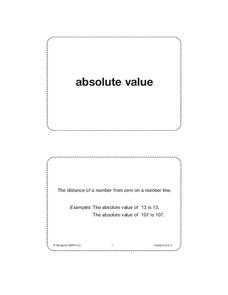
Unit 4 Math Vocabulary Cards (Grade 6)
Reinforce math vocabulary with a set of flash cards. Forty-eight cards offer boldly printed words, and their corresponding definition alongside an example with labels. Terms include absolute value, inverse operations, slope, and more!
EngageNY
Representing, Naming, and Evaluating Functions (Part 2)
Notation in mathematics can be intimidating. Use this lesson to expose pupils to the various ways of representing a function and the accompanying notation. The material also addresses the importance of including a domain if necessary....
EngageNY
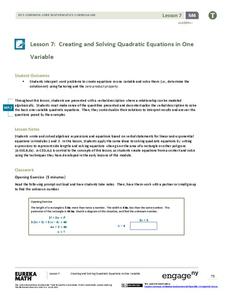
Creating and Solving Quadratic Equations in One Variable
Give your classes practice at modeling using quadratic models with a resource that uses area and integer problems to allow individuals to create second degree polynomials. Young mathematicians solve equations using factoring and then...
EngageNY
The Height and Co-Height Functions of a Ferris Wheel
Show learners the power of mathematics as they model real-life designs. Pupils graph a periodic function by comparing the degree of rotation to the height of a ferris wheel.
West Contra Costa Unified School District
Writing Exponential Functions Based on Data
Give your class a concrete example of exponential growth and decay using this hands-on activity. These Algebra II lessons allow for the exploration of exponential growth and decay models, as well as the discovery of the patterns of...
California Education Partners
T Shirts
Which deal is best? Learners determine which of two companies has the best deal for a particular number of shirts. They begin by creating a table and equations containing each company's pricing structure....
EngageNY
Comparing Linear Functions and Graphs
How can you compare linear functions? The seventh installment of a 12-part module teaches learners how to compare linear functions whose representations are given in different ways. They use real-world functions and interpret features in...
Education Development Center
Creating a Polynomial Function to Fit a Table
Discover relationships between linear and nonlinear functions. Initially, a set of data seems linear, but upon further exploration, pupils realize the data can model an infinite number of functions. Scholars use multiple representations...
Curated OER
Algebra- Cell Phone Plans
Young scholars analyze graphs to compare cell phone plans. In this algebra lesson, students work together to analyze phone plans and report the best phone plan. Young scholars develop tables and graphs.
Curated OER
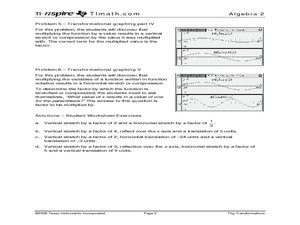
Trig Transformations
Learners investigate trigonometric function. In this Algebra II lesson, young scholars explore functional notation and transformational graphing of trigonometric functions.
West Contra Costa Unified School District
Introduction to Inverse Functions
Ready to share the beauty of the inverse function with your classes? This algebra II lesson guides the discovery of an inverse function through a numerical, graphical, and an algebraic approach. Connections are made between the three,...
EngageNY
Solution Sets to Equations with Two Variables
Can an equation have an infinite number of solutions? Allow your class to discover the relationship between the input and output variables in a two-variable equation. Class members explore the concept through tables and graphs and...
Curated OER
Algebra
Students practice using a function machine online to help them with functions. They examine the relationship between input and output. They discover the rule for the change when completing these types of problems.
Curated OER
Linear and Exponential Functions
This comprehensive unit on linear and exponential functions provides numerous clearly-written worksheets. Topics include graphing linear equations, solving systems of equations algebraically and by graphing, identifying the domain and...
Illustrative Mathematics
Oakland Coliseum
Help algebra learners relate a real-life function that happens at the Oakland Coliseum every time the Raiders play. The resource states that the revenue of the Oakland Raiders home games is a function of the number of seats sold and the...


