Illustrative Mathematics
US Garbage, Version 1
An interesting example of a discrete function and how it is applies to the real world. This could easily make a good collaborative lesson with an environmental science class. Practice reading a table and drawing a scatter plot make up...
Curated OER
Making Connections
Eighth graders investigate the input/output model for building function tables. From the data, 8th graders connect tables, graphs, function rules, and equations in one variable. They work backwards to determine function rules for given...
Curated OER
Guess My Rule
Students drill on math patterns, functions and Algebra. They construct and use tables to solve problems associated with mathematical relationships and identify a rule/equation. Students comprehend input/output to determine the...
Illustrative Mathematics
Distance across the channel
Here you will find a model of a linear relationship between two quantities, the water depth of a channel and the distance across the channel at water level. The cross section of the channel is the shape of an isosceles trapezoid. The...
Curated OER
Function Tables
Students identify function using tables of data. For this algebra lesson, students create a tale of point and plot on a coordinate plane. They analyze the graph as being a function or not.
02 x 02 Worksheets
Inverse Functions
Young mathematicians look for patterns in inverse functions as they relate to the original functions. The comprehensive lesson emphasizes vocabulary throughout as well as algebraic and graphical characteristics of the inverse functions.
Inside Mathematics
Quadratic (2009)
Functions require an input in order to get an output, which explains why the answer always has at least two parts. After only three multi-part questions, the teacher can analyze pupils' strengths and weaknesses when it comes to...
Inside Mathematics
Functions
A function is like a machine that has an input and an output. Challenge scholars to look at the eight given points and determine the two functions that would fit four of the points each — one is linear and the other non-linear. The...
Shodor Education Foundation
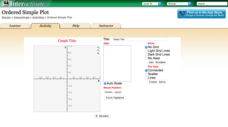
Ordered Simple Plot
Open your imagination to make algebra-inspired creations. An interactive lesson has scholars graph images from a set of parameters. Users can practice minimum values, maximum values, and scale as well as key features.
Shodor Education Foundation
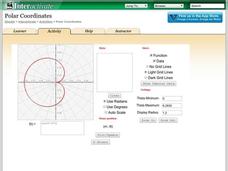
Polar Coordinates
Polar opposites might not work together—but polar coordinates do! The interactive provides learners the opportunity to graph trigonometric and algebraic functions using polar coordinates. The program takes either individual data points...
Curated OER
Worksheet 2: Functions as Machines
In this algebra worksheet, students read about the concept of functions and how to apply them. Then they fill in the graphic organizer with the right type of functions.
Curated OER
Binary Math Circuits
In this Algebra II/Pre-calculus instructional activity, students analyze and build digital circuits. The six page instructional activity contains eleven problems. Answers not included.
Curated OER
Understanding Variables
Students solve linear equations and identify the unknown. In this algebra lesson, students define a variable and use addition, subtraction, multiplication and division to solve. They change the equation depending on the value of the...
Curated OER
Functions
In this algebra worksheet, students look at 4 sets of relations and determine if they are functions. Students are provided with the graphs of three functions and determine the function value. Two relations are graphed on the coordinate...
Curated OER
Function Tables
In this function table worksheet, 5th graders solve and complete 10 different function tables shown. First, they determining the ordered pairs in each table. Then, students use number patterns to complete each table filling in the output...
Inside Mathematics
Party
Thirty at the party won't cost any more than twenty-five. The assessment task provides a scenario for the cost of a party where the initial fee covers a given number of guests. The class determines the cost for specific numbers of guests...
Curated OER
Algebraic Equation Manipulation for Electric Circuits
In this electric circuit worksheet, students use Algebraic equations to manipulate the electrical resistance of a conductor. The answer a series of 19 open-ended questions. This worksheet is printable and the answers are revealed online.
Curated OER
Mine Shaft Grade 8 Slope
Eighth graders investigate slopes using real life scenario. In this algebra lesson, 8th graders model and interpret real life data. They plot their data in a coordinate plane and discuss the results with the class.
Curated OER
What is Log?
Young mathematicians differentiate between logs and natural logs in this algebra lesson. They solve functions and logarithmic functions. Learners also graph and rewrite the exponential and log functions.
Curated OER
Relations and Functions
Students differentiate between a relation and a function. For this algebra lesson, students identify a pair of coordinates as being a relation or a function. They analyze graphs for function as they solve word problems.
Curated OER
Functions and Their Graphs.
Students solve equations and label it as a function or not. In this algebra lesson, students make a table of values and graph their equation. They identify the domain and range of each graph.
Curated OER
Computing with Mathematical Formulas
Learners solve problems using formulas. In this algebra lesson, students evaluate numbers using substitution. They graph their answers using a TI and discuss the outcome.
Curated OER
Graphing Linear Equations with Calculator
Young scholars graph lines using the calculator. In this algebra lesson, students graph lines of equations in the form y=mx+b. They input equations into the TI Calculator and graph using the slope and intercept. They analyze the graph...
Curated OER
Equations using Visuals
For this algebra worksheet, students write equations from a given diagram. They relate these problems with functions having to do with inputs and outputs. There are 10 diagrams to be deciphered.


