Curated OER
El Tiempo en Chile
Learners analyze what information would one expect to find in a weather report. They list in Spanish weather conditions for today in their community. Students visit Chile and locate it on a map.
Discovery Education
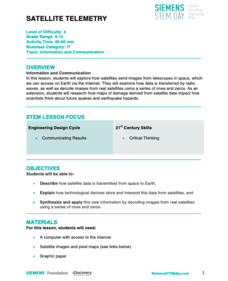
Satellite Telemetry
Satellites require rockets to launch, but it doesn't take a rocket scientist to understand them. Future engineers learn about how satellites send data to Earth and how to interpret satellite images. They see how radio waves play a role...
Curated OER
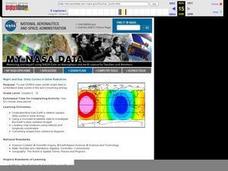
NIGHT AND DAY: DAILY CYCLES IN SOLAR RADIATION
High schoolers examine how Earth's rotation causes daily cycles in solar energy using a microset of satellite data to investigate the Earth's daily radiation budget and locating map locations using latitude and longitude coordinates.
Curated OER
Ann Arbor Growth & Immigration
Third graders describe some of the factors that brought early settlers to Ann Arbor. They read Narrative-A Trip from Utica, New York, to Ingham County, Michigan in 1838. As an added challenge, 3rd graders can use maps to track Silas...
Curated OER
Hopeful Eyes on Southern Skies
The Times covered a drought in 2011, which affected producers, consumers, and sellers. The class gets informed about climate and the economics of agriculture as the read this article and answer each of the 11 comprehension questions. A...
Curated OER
Analyzing Journey North Maps
Learners analyze what's happening and interpret why it's happening as the season progresses.
Curated OER
A Thoreau Look at Our Environment
Sixth graders write journal entries o school site at least once during each season, including sketched and written observations of present environment. They can use sample topographical maps and student's own maps. Students can use...
Curated OER
What is Climate?
Learners explore the differences between climate and weather. For this introductory lesson of a climate unit, students discuss the vocabulary and concepts associated with weather and climate. They build their information base for the...
Curated OER
Creating Climographs
Students chart statistical information on graphs, interpret the information and use it to explain spatial relationships, and identify the relationship between climate and vegetation.
Curated OER
Gallery Walk Questions on Rivers
A Gallery Walk is a technique that allows small groups to visit different stations, where they examine and discuss materials about an overarching topic. Questions about rivers and fluvial processes are available in this resource;...
Curated OER
Using Non-Text Features
Second graders examine graphs and charts from their local newspaper. As a class, they discuss what the data means and how it relates to the article. In groups, they are shown two sets of graphs or charts and they practice explaining...
Curated OER
Will It Rain Today or Tomorrow?
Learners examine how to forecast weather. They examine the different types of weather and learn the correct vocabulary.
Polar Trec
Global Snow Cover Changes
Snow is actually translucent, reflecting light off its surface which creates its white appearance. Pairs or individuals access the given website and answer questions about snow cover. They analyze graphs and charts, examine data, and...
Curated OER
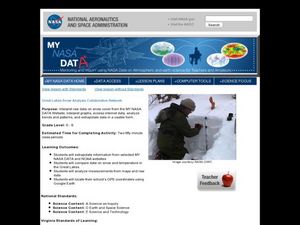
Great Lakes Snow Analysis Collaborative Network
Students interpret data on snow cover and analyze trend patterns. For this snow lesson students compare data and locate their school's GPS coordinates.
Curated OER
El Nino
Students explain what El Nino is, where it is located and how it is created. They describe the weather changes caused by El Nino. They draw the patterns of El Nino on a world map. They predict economic effects El Nino has on the areas it...
Curated OER
Climographs
Students identify trends and characteristics of climate zones and specific places within. Then, they graph annual climate trends (primarily Temperature and Precipitation) and create, interpret and extrapolate information based on...
Alabama Learning Exchange
The Sun and the Earth
Third graders study and diagram the positions of the Earth and sun during the four seasons. They predict weather for cities in the northern and southern hemispheres.
Curated OER
Temperature High and Lows
Learners gather high and low temperature readings through email. For this temperature graphing lesson, students use a spreadsheet to input data for a graph. learners interpret the graphs to compare and contrast the data from different...
Curated OER
Kalahari Explorations
Students explore world geography by completing graphic organizers and researching the Internet. In this Kalahari desert instructional activity, students identify the geographic location, weather and creation of the Kalahari desert....
Curated OER
The Geography of Tornadoes OR
Students learn some basic facts about tornadoes and map two selected tornado statistics by state, and observe, analyze and speculate about the pattern(s) created by the completed map.
Curated OER
Troical Atlantic Aerosols
Students explore the effect aerosols have upon he weather and climate. They observe NASA satellite images to explore and draw conclusions about aerosol transport. From studying the images, students track the path of aerosols. They...
Curated OER
The Bulbs: Camas and Daffodil
Fourth graders become aware of the importance of the camas bulb to the Nez Perce people, they learn the parts of plants, and gain understanding of the interdependence of Nature. They study about the possible causes and outcomes of global...
Curated OER
Animal Trackers
Students use space technology to monitor migratory species, map their movements, and gather data about their habitats and possible responses to climatic shifts.
Curated OER
Balancing the Scales: Understanding Ratios
Students are introduced to the concept of ratios. In groups, they convert sets of numbers into a ratio. After practicing, they use the ratios and proportions to solve story problems. They also calculate map distances and discover map...


