Curated OER
Interpreting Circle Graphs
What does this pie chart mean? Once scholars can analyze a circle graph on a basic level (i.e. "Most people prefer cats"), it's time to delve deeper into it. They examine two graphs here, and are given the total number of participants...
Math Mammoth
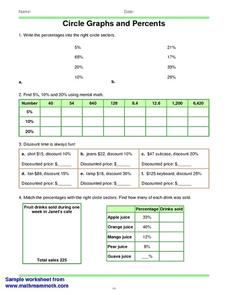
Circles Graphs and Percents
In this percent instructional activity, students read and interpret circle graphs. They determine discounts, and match percentages with circle sectors. This one-page instructional activity contains approximately 30 problems.
Curated OER
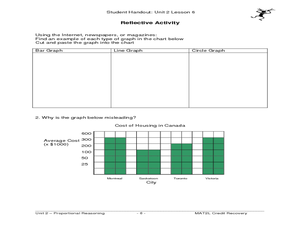
Leveled Problem Solving: Circle Graphs
For this circle graphs worksheet, students solve 6 word problems based on a circle graph about the most popular classes for sixth graders. Students calculate angle measures of circles for 2 of the problems.
Curated OER
Choose an Appropriate Graph
In this graphs learning exercise, students solve 6 fill in the blank problems where they choose the most appropriate type of graph for each set of data and explain why they chose that type. Students use bar graphs, histograms and circle...
Curated OER
The Circle Graph
In this circle graph worksheet, students complete problems involving many circle graphs including a compass rose, degrees, and more. Students complete 7 activities.
Inside Mathematics
Squares and Circles
It's all about lines when going around. Pupils graph the relationship between the length of a side of a square and its perimeter. Class members explain the origin in context of the side length and perimeter. They compare the graph to the...
Willow Tree
Bar Graphs
Circles, lines, dots, boxes: graphs come in all shapes in sizes. Scholars learn how to make a bar graph using univariate data. They also analyze data using those bar graphs.
Curated OER
Review For Test 3
In this test worksheet, students interpret circle graphs, bar graphs, and line graphs. They match graphs to their appropriate linear equation. Students determine the slope of a line. There are 20 problems on this six page worksheet. ...
Curated OER
7th Grade Math Worksheet
In this integers activity, 7th graders solve 10 different problems that include various types of integers and graphs. First, they determine the sum of 3 consecutive integers. Then, students find the ratio between 2 areas of similar...
Mathed Up!
Pie Charts
Representing data is as easy as pie. Class members construct pie charts given a frequency table. Individuals then determine the size of the angles needed for each sector and interpret the size of sectors within the context of frequency....
Willow Tree
Histograms and Venn Diagrams
There are many different options for graphing data, which can be overwhelming even for experienced mathematcians. This time, the focus is on histograms and Venn diagrams that highlight the frequency of a range of data and overlap of...
Curated OER
Reading Graphs
For this reading graphs practice worksheet, students examine a graph and respond to 5 questions that require them to record the coordinates of 5 shapes on the gridded graph.
Curated OER
Understanding Statistics
In this statistics worksheet, students examine and interpret pictographs and line graphs. Students analyze the provided data in order to create bar graphs, circle graphs, and box and whisker plots. The nine page worksheet accompanies a...
Curated OER
Introductory Algebra Chapter 3 Review
In this math worksheet, students find the solutions to the problems while interpreting the line, bar, and circle graphs. The examples are given to help in the context of each objective.
Mt. San Antonio Collage
Quiz 1: Types of Functions
Sometimes the best things are already done for you! Here is a six-problem quiz that has a variety of problems ranging from solving quadratic equations to interpreting a function. The piece-de-resistance is the worked out answer key in...
Curated OER
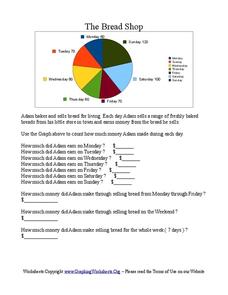
The Bread Shop
In this pie chart worksheet, learners use the pie chart graph to count the money Adam made in the Bread Shop. Students complete 10 questions.
Curated OER
Statistical Inquiry
In this statistical inquiry worksheet, students analyze and interpret a variety of diagrams such as a scatter plot, bar graph and pie charts. They create tables and other diagrams to support given data. This two-page worksheet contains 3...
West Contra Costa Unified School District
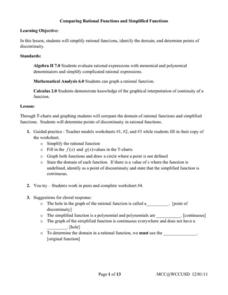
Comparing Rational Functions and Simplified Functions
What kind of functions have holes in their graphs? Here, the teacher guides the class on how to use the simplified function of a rational function to aid in the graphing of the original rational function. T-tables are used in order to...
Bowland
Fruit Pies
Scholars use formulas for the area of a circle and the area of a rectangle to determine the number of pies a baker can make from a particular area of dough. They must also take into account rolling the remaining dough into a new sheet.
Curated OER
Venn Diagrams, Part 3
Can your first graders interpret Venn diagrams? Different sets of clues help pupils narrow down a specific number in different shapes. They determine odds and evens, greater than or less than, and what shape the number is in. A fun...
Curated OER
Patterns of Evolution and Selection
Can your young biologists interpret population graphs, match macroevolution patterns and descriptions, and answer multiple choice questions about evolution? Find out with a comprehensive three-page quiz covering some specific examples of...
Curated OER
Favorite Animal at the Zoo - Making a Pie Chart
In this graphing and interpretation worksheet set, learners draw charts that are either blank or outlined that show information about students' favorite zoo animals. They answer questions based on the data in 15 examples.
Curated OER
My Test Book: Reading Pie Charts
In this math skills worksheet, students solve 9 multiple choice math problems that require them to read and interpret charts. Students may view the correct answers.
Curated OER
Data Handling
In this data handling instructional activity, learners explore multiple ways to represent data. They create stem and leaf plots, histograms, and bar charts. Students examine and interpret diagrams and statistics. This eleven-page...


