Curated OER
A Real Difference
Fifth graders use the Celsius and Fahrenheit thermometers to compare temperature readings. They use the Internet to find the temperatures of selected cities. After data is collected for five days, 5th graders graph the temperatures.
Curated OER
Favorite Christmas Carols
Third graders take a survey of friends' and family members' favorite Christmas carols. They illustrate a favorite Christmas carol and have students try to guess the name of the carol based on the picture.
Curated OER
One Square Foot
Students identify, describe, count, tally, and graph life found in one square foot of land.
Curated OER
Home on the Biome
Fifth graders study six major biomes, graph temperature and rainfall, and present their findings to the class.
Curated OER
Down by the Bay
Young scholars listen to teacher read books about fish and participate in activities in order to explore how to identify bluefish. They count and graph the numbers of fish they find in simulated fishing activities.
Curated OER
The Stock Exchange Phase I
Second graders select a stock and follow its ups and downs, using graphs to show its success.
Curated OER
Making Sense of the Census
In this unit of lessons, students make sense of the Census. They examine why a census is taken and participate in activities.
Curated OER
What is a Cloud
Third graders study clouds and how they are formed. They write acrostic poems about clouds and analyze and graph temperature data collected during varying degrees of cloud cover.
Curated OER
Year of the Impossible Goodbyes by Sook Nyul Choi
Students analyze Korean culture from their literature piece. They investigate the theme of oppression by an occupying army. Students encounter courage, resistance movements and explore the underground railroads.
Curated OER
Calligraphy: Symbols & Signs - Visual Arts
Students research the forms and significance of calligraphy in traditional and contemporary Chinese society. They design a mixed media scroll on paper, developing symbols for use as calligraphic images. Students describe how selected...
Curated OER
Classroom Census
Young scholars take a classroom census. They count in sets, sortan classify groups and ascertain the value of counting.
Curated OER
Mother May I?
Third graders measure distance using nonstandard units of measure. In this measurement lesson, 3rd graders measure a given distance through the use of the game "Mother May I?" Student gather and compare data on how many "giant steps" and...
Curated OER
Math Made Easy
Young scholars evaluate word problems. In this problem solving lesson plan, students are presented with word problems requiring graphing skills and young scholars work independently to solve.
Mangahigh
Mangahigh: Data: Use and Interpret Pictographs
This site provides students practice with the concept of pictographs. Students can learn about the topic by completing an interactive tutorial. Students can then take a ten question timed test to practice the skill.
Glenbow Museum
Glenbow Museum: Pictograph Robes of the Plains Indians
Plains Indians often recorded their history in pictograph form on their tipis and buffalo skins. View the original artwork by He Dog (Percy Creighton)as he interpreted the history of the Blood Indians.
Beacon Learning Center
Beacon Learning Center: Play Ball
An interactive web lesson shows examples of pictographs and challenges students to answer questions about the graphs.
BBC
Bbc: Representing Data
This BBC Math Bite tutorial for line graphs, pictograms, and frequency polygons features an exam in which students draw and interpret statistical diagrams.
Beacon Learning Center
Beacon Learning Center: I Am Special
An interactive web lesson introduces students to picture graphs. It also allows them to practice creating and interpreting the graphs.
E-learning for Kids
E Learning for Kids: Math: Orange Trees, Olive Trees: Data and Capacity
In this lesson, students collect data related to a question, compare and order the capacity of containers, and interpret picture graphs.
ClassFlow
Class Flow: Explore a Pictograph
[Free Registration/Login Required] This is a 2nd grade lesson on how to interpret information on a pictograph when each picture stands for more than one unit.
Government of Alberta
Learn Alberta: Math Interactives: Exploring Election Data
Using actual Alberta provincial election results, students have the opportunity to interpret election data using a variety of graph types. Pictographs, line graphs, bar graphs, circle graphs, and data tables are covered in this...
Khan Academy
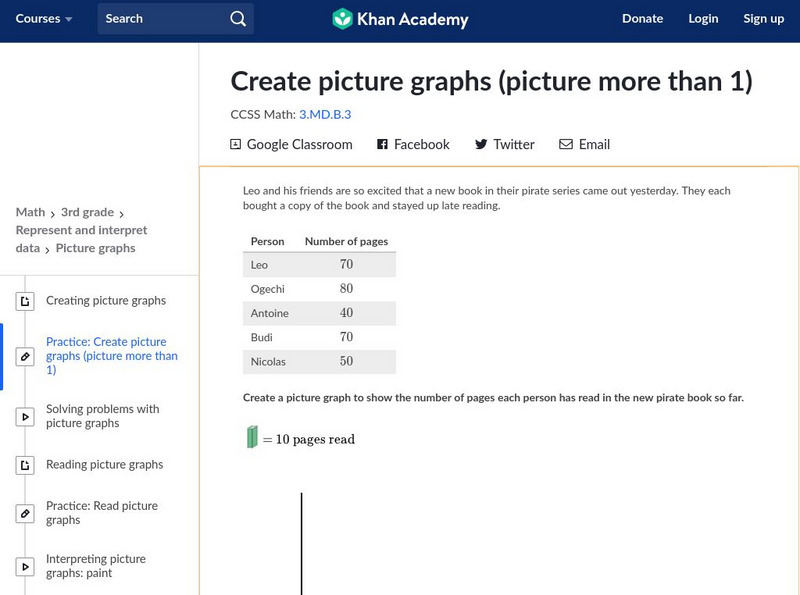
Khan Academy: Create Picture Graphs (Picture More Than 1)
Create and interpret picture graphs. Students receive immediate feedback and have the opportunity to try questions repeatedly, watch a video tutorial, or receive hints about how to create picture graphs. CCSS.Math.Content.3.MD.B.3 Draw a...
Khan Academy
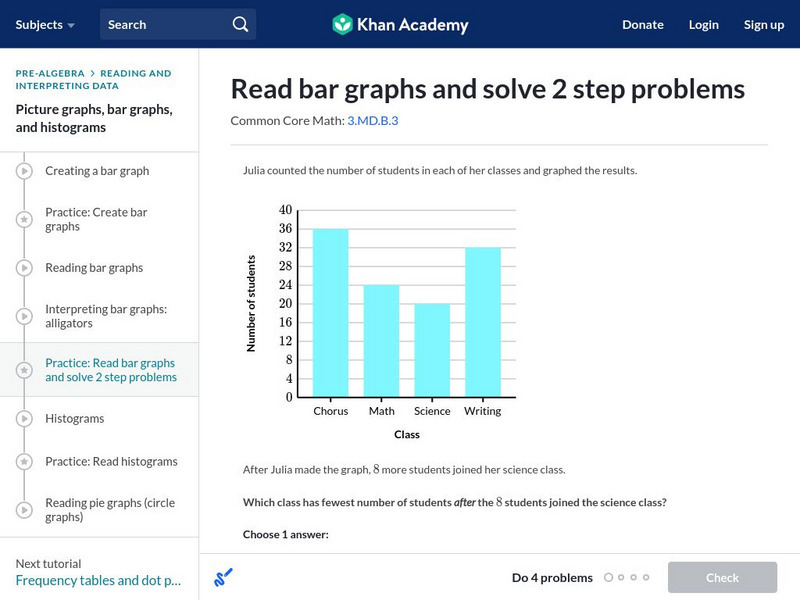
Khan Academy: Read Bar Graphs and Solve 2 Step Problems
Read and interpret a double bar graphs. Students receive immediate feedback and have the opportunity to try questions repeatedly, watch a video or receive hints. CCSS.Math.Content.3.MD.B.3 Draw a scaled picture graph and a scaled bar...
E-learning for Kids
E Learning for Kids: Math: Treasure Island: Interpreting Data
Students will play interactive games to interpret information from different types of graphs.


