Curated OER
Reading Weather Maps
Fourth graders the symbols that are used on weather maps. They develop five day forecasts based on information they gather from weather maps in the newspaper and on the Internet.
NASA
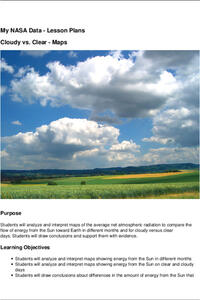
Cloudy vs. Clear - Maps
Find out the science of how clouds keep Earth cooler on hot days. Using guided discussions, investigators analyze and interpret maps of how much solar energy Earth receives at different times of the year. Participants draw conclusions...
Curated OER
Regents High School Examination: Physical Setting Earth Science 2009
Junior geologists address 50 multiple choice questions and 35 short answer questions about the earth system. Plenty of visuals are included for interpretation: diagrams, graphs, maps, photographs, laboratory setups, weather symbols, and...
Curated OER
Learning Lesson: Analyzing a Weather Map
Students use weather maps to locate warm and cold fronts. They discover the different types of weather associated with these fronts. They also observe the weather in their local area.
Curated OER
Weather Reporting
Students locate a weather map on the internet and explain or predict the weather for the following day. Students interpret the information on the weather map and pick the correct clothing to wear for that day. Students chart and graph...
Office of the New Jersey State Climatologist
Play Ball! – Or Not…Making a Decision Using Weather Data
Should the game go on or not? An engaging lesson asks small groups to make a decision using weather data. After analyzing a map, an updated forecast, and radar information, groups have to decide whether to cancel a baseball game. They...
Curated OER
Weather Maps
Pupils interpret information on a weather map in order to construct a graph, and discuss how the weather impacts their lives.
Curated OER
What's Your Temperature?
Learners take a look at the local newspaper and focus on the weather section. They get into small groups, and each one looks at the same map, but of a different part of the country. They must prepare a presentation that shows how...
Chicago Botanic Garden
Historical Climate Cycles
What better way to make predictions about future weather and climate patterns than with actual climate data from the past? Young climatologists analyze data from 400,000 to 10,000 years ago to determine if climate has changed over time....
California Academy of Science
California's Climate
The United States is a large country with many different climates. Graph and analyze temperature and rainfall data for Sacramento and Washington DC as you teach your class about the characteristics of Mediterranean climates. Discuss the...
Curated OER
Interpreting Weather Station Symbols
In this science worksheet, students look at the symbols on the map and make interpretations about temperature or other conditions to master the weather knowledge in the four problems.
Curated OER
Gallery Walk Questions on Weathering and Mass Wasting
A set of questions on weathering and erosion are found in this resource. Some of them can be used as discussion topics or lecture guides. There are also suggested activities such as the examination of topographic quadrangles and the...
Curated OER
A Weather Map Worksheet
In this science worksheet, middle schoolers examine the data given on a map in order to answer the questions related to performing weather interpretation.
Curated OER
CLIMATE AND WEATHER UNIT
Students locate on-line weather source, gathers and interprets weather data, work collaboratively on-line with other schools to collect weather data, and write about the cause of temperature inconsistencies in various locations.
Curated OER
Storm Clouds-- Fly over a Late Winter Storm onboard a NASA Earth Observing Satellite
Students study cloud data and weather maps to explore cloud activity. In this cloud data lesson students locate latitude and longitude coordinates and determine cloud cover percentages.
Curated OER
Creating Station Models
Students work in groups to interpret weather maps. They use latitude and longitude readings to complete a worksheet together and turn in the worksheet along with the maps and a rubric.
Curated OER
Weather Forecast
Students explore the vocabulary for making statements about the weather in various cities. They respond with the use of the appropriate interpretive strategies to show the directions in the taget language for placing weather symbols on...
Curated OER
Weather, Data, Graphs and Maps
Students collect data on the weather, graph and analyze it. In this algebra lesson, students interpret maps and are able to better plan their days based on the weather reading. They make predictions based on the type of clouds they see.
Curated OER
Creating Station Models
Learners review weather conditions at various cities and create station models on a weather map.
Curated OER
A Comparison of Cloud Coverage Over Africa
Students use a NASA satellite data to contrast amounts of cloud coverage over different climate regions in Africa. They explore how Earth's major air circulations affect global weather patterns, and relate to local weather patterns.
Curated OER
Settlement Exploration: Then and Now
NASA has crafted an imaginative and memorable series of lessons, "NASA and Jamestown Education Module." This instructional activity is one of the five components. In it, middle schoolers connect history and science by comparing the...
Curated OER
Make Your Own "Weather" Map
High schoolers create their own "weather" map using data from x-ray sources. They analyze and discuss why it is important to organize data in a fashion in which is easy to read. They compare and contrast different x-ray sources using a...
NASA
Cloudy vs. Clear - Graphs
Explore the link between solar energy and cloud cover using real data from NASA from China! Future climatologists analyze and interpret graphs of solar energy on clear and cloudy days using a literacy cube. Investigators draw conclusions...
Curated OER
Investigation 7 - Interpreting Weather Data
Fourth graders interpret the weather data they gathered in Investigation 6. They take an average of each component in each season. They compare the same components of each season and write the differences they see between the seasons.


