Curated OER
Globe Skills Lesson 8 Dust Bowl Travelers
Students develop their globe and map skills, In this geography lesson, students examine the Dust Bowl as they complete an activity that requires them to plot latitude and longitude.
Curated OER
GPS Scavenger Hunt
Learners go on a GPS scavenger hunt. They use GPS receivers to find designated waypoints and report back on what they found. They compute distances between waypoints based on the latitude and longitude, and compare with the distance the...
Curated OER
Walking that Line
Young scholars attempt to describe and use longitude and latitude. They will identify different countries, their neighbors, and borders around the world. Included in the instructional activity the students identify natural features that...
Curated OER
Snow Cover By Latitude
Students examine computerized data maps in order to create graphs of the amount of snowfall found at certain latitudes by date. Then they compare the graphs and the data they represent. Students present an analysis of the graphs.
Curated OER
Map Coordinate Bingo
Students play a bingo-type game to locate cities by coordinates. They explain the use of orientation on a map and identify cities in the western hemisphere. They compare road maps, shutttle images, and a CIR image and obtain an...
Curated OER
Hot, Wet, and Cold
Students research climate data for a city in each of the 5 major geographic sections of Texas. They use data to describe the climate and what influence the geography of that section has on the weather.
Curated OER
Science: Hurricanes As Heat Engines
Pupils conduct Internet research to track the path of Hurricane Rita. They record the sea surface temperature of the Gulf of Mexico during and after the hurricane and draw conclusions about how hurricanes extract heat energy from the...
Curated OER
Some Things You Need to Know to Read a Map
Students study things the you need to know to read a map and explain location.
Curated OER
Sunrise and Sunset - Graph of Daily Solar Radiation
Students use a graph of daily solar radiation to determine the times of sunrise and sunset. They also compare how sunrise, sunset, and the length of the day changes with latitude and longitude.
Curated OER
The Pilgrims
Students use distance measuring tools to follow directions and chart the path the pilgrims made from Plymouth, England to Boston, Massachusetts. In this Pilgrim voyage lesson, students use a map to chart the distance traveled by the...
Curated OER
Factors That Affect Climate
Fifth graders use captured portions of the Internet ("mininets") to perform research into climate. They create graphs of the data recorded using latitude as the independent variable and temperature as the dependent variable.
Curated OER
Linkages Between Surface Temperature And Tropospheric Ozone
Students collect and interpret data to make predictions about the levels of ozone in the atmosphere. Using the internet to collect data students use their collected data to create a line graph for analysis. Students make mathematical...
Curated OER
Absolute and Relative Location
Second graders understand the difference between relative and absolute location using the grid map as an example of an absolute location. They observe a class map showing longitude and latitude lines and learn that they provide exact...
Curated OER
Charles Lindberghs's Flight to Paris
Students practice map skills. In this map skills lesson, students locate the cities of New York and Paris on a map. Students read about the flight made by Charles Lindbergh in May 1927 from New York to Paris. Students answer 8 questions...
Curated OER
Globe Foldable
Maybe the world wasn't built in a day but kids can certainly assemble a globe in one class period using the images provided by these templates. Cut, fold, piece, glue, and voila!
Curated OER
From Home to School, GPS Style
Students are introduced and increase proficiency in the use of the hand held GPS system. They explore the meaning of longitude and latitude lines, then identify the parts of the map.
Curated OER
The Librarian Who Measured the Circumference of the Earth
Sixth graders explore angles, triangles, and investigate the circumference of the earth. They participate in a Webquest, access data bases, and communicate with other students through an on-line project site involving the circumference...
Curated OER
Baseball Challenge - Basic Geography Skills
A fabulous presentation/activity based on geography. The author has designed a "baseball game" where batters advance to the next base if they correctly answer a multiple choice question about geography. Geographic terms are used, along...
Curated OER
Natural Disasters and the Five Themes of Geography
Have your class do research on natural disasters and create a presentation using this resource. In completing this activity, learners apply the five geography themes to their research. They write a paper describing their results. It's a...
Curated OER
A Bird's Eye View of our 50 States
Third graders focus on state birds as they learned absolute location (latitude/longitude) of each state, as well as their relative location (bordering states).
Curated OER
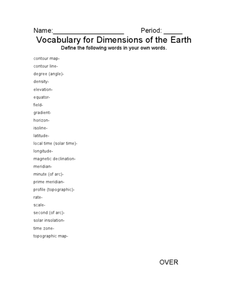
Vocabulary for Dimensions of the Earth
In this Earth dimensions worksheet, students define 24 terms associated with contour maps, latitude, longitude, and time zones.
Curated OER
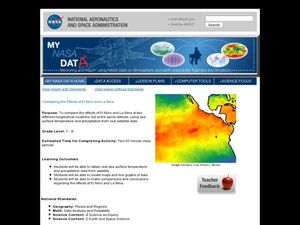
Comparing the Effects of El Nino and La Nina
Students examine the differences between an El Nino and La Nina year. In this investigative lesson students create maps and graphs of the data they obtained.
Curated OER
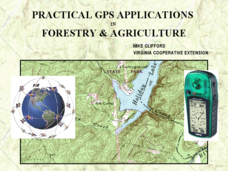
Practical GPS Applications in Forestry & Agriculture
An explanation of the Global Positioning System (GPS) and the Geographic Information System (GIS) is given in this presentation. Uses and applications are considered. How it works and sources of error are also touched upon. A large...
National Wildlife Federation
I Speak for the Polar Bears!
Climate change and weather extremes impact every species, but this lesson focuses on how these changes effect polar bears. After learning about the animal, scholars create maps of snow-ice coverage and examine the yearly variability and...


