Curated OER
What A Tombstone Can Tell Us
In this coordinates worksheet, students determine the coordinates to visit a cemetery. Students determine 18 coordinates on this worksheet.
Curated OER
Plotting Earthquakes
In this earthquakes learning exercise, students access a website to gather information about the magnitude and location of earthquakes for 5 days. Then students complete 7 short answer questions.
Curated OER
Science: Hurricanes As Heat Engines
Students conduct Internet research to track the path of Hurricane Rita. They record the sea surface temperature of the Gulf of Mexico during and after the hurricane and draw conclusions about how hurricanes extract heat energy from the...
Curated OER
Carbon Monoxide and Population Density
Tenth graders investigate the carbon monoxide level at a fixed latitude. They determine if there is a relationship to population density. They download data sets and generate a graph. They determine a link between human activity and...
Statistics Education Web
What Percent of the Continental US is Within One Mile of a Road?
There are places in the US where a road cannot be found for miles! The lesson asks learners to use random longitude and latitude coordinates within the US to collect data. They then determine the sample proportion and confidence interval...
Curated OER
Celebrating 100 Years of Negro Leagues Baseball
Ninth graders locate original locations of Negro Leagues Baseball teams using latitude and longitude, calculate distances between locations using maps and/or Internet resources, and use critical thinking skills to compare and contrast...
Curated OER
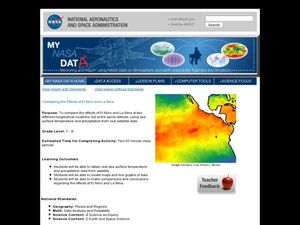
Comparing the Effects of El Nino and La Nina
Young scholars examine the differences between an El Nino and La Nina year. In this investigative activity students create maps and graphs of the data they obtained.
Curated OER
Earthquake Depth
Students research and locate earthquake epicenters on a map using latitude and longitude. They determine if the depth of an earthquake has any relationship to the distance from a plate boundary.
Curated OER
The Distribution of Earthquakes
Students determine the rate of seismicity by determining the frequency of aftershocks following a major earthquake. They incorporate the use of the Internet, Excel 2000, a map of their area with latitude and longitude markers, and paper...
Curated OER
GPS Scavenger Hunt
Students go on a GPS scavenger hunt. They use GPS receivers to find designated waypoints and report back on what they found. They compute distances between waypoints based on the latitude and longitude, and compare with the distance the...
Curated OER
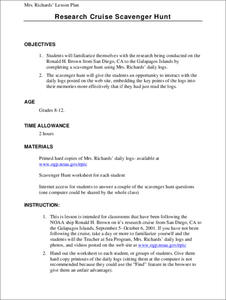
Research Cruise Scavenger Hunt
Students track the research cruise of the Ronald H. Brown from San Diego to the Galapagos Islands. They match research groups with the key words, using the ship's daily logs to find the answers.
Curated OER
How to be a Great Navigator!
Young scholars, through teacher lecture and class discussion, explore historical methods of navigation: dead reckoning and celestial navigation.
US Mint
Absolutely and Relatively: The Puerto Rico Quarter Reverse
How much does your class know about Puerto RIco? How much can they learn from the back of a 2009 quarter? Use the coin, part of a series of quarters that depict US territories, to teach learners about the geography, culture, and history...
Curated OER
Charles Lindberghs's Flight to Paris
Students practice map skills. For this map skills lesson, students locate the cities of New York and Paris on a map. Students read about the flight made by Charles Lindbergh in May 1927 from New York to Paris. Students answer 8 questions...
Curated OER
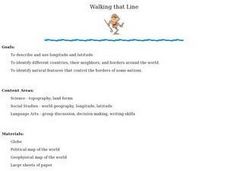
Walking that Line
Students attempt to describe and use longitude and latitude. They will identify different countries, their neighbors, and borders around the world. Included in the lesson the students identify natural features that control the borders of...
Curated OER
Locating Patterns of Volcano Distribution
Pupils examine patterns of volcanic distribution worldwide, use tables to plot and label location of each volcano on map, lightly shade areas where volcanoes are found, and complete open-ended worksheet based on their findings.
Curated OER
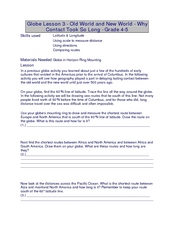
Old World and New World - Why Contact Took So Long
Students use a globe to determine why contact between the old world and the new world took a long time. In this map skills lesson, students analyze routes between regions to determine why it took so long for the old world and the new...
Curated OER
Applications of the Pythagorean Theorem - Magnetism
Middle and high schoolers use the Pythagorean Theorem to complete a table showing with the magnetic field strengths in given cities. They find the average value of the Earth's magnetic field and plot one of the three-dimensional values...
Mr. Head's 6th Grade Classroom
Absolute Location
How do we know where we are in the world? A presentation for middle schoolers explains absolute location and other geography terms such as relative location. It also gives scholars the opportunity to practice finding absolute location on...
Curated OER
Geographics in Arkansas
Third graders discuss where Arkansas is located on the United States map. They use geographic tools to participate in activities.
Curated OER
Make Your Own "Weather" Map
Students create their own "weather" map using data from x-ray sources. They analyze and discuss why it is important to organize data in a fashion in which is easy to read. They compare and contrast different x-ray sources using a stellar...
Curated OER
Snow Cover By Latitude
Students examine computerized data maps in order to create graphs of the amount of snowfall found at certain latitudes by date. Then they compare the graphs and the data they represent. Students present an analysis of the graphs.
Curated OER
A Bird's Eye View of our 50 States
Third graders focus on state birds as they learned absolute location (latitude/longitude) of each state, as well as their relative location (bordering states).
Curated OER
Planet Earth
Students explore and analyze data from different maps in order to explain geographic diversity among the continents. Student groups research continents' physical features and examine how they contribute to quality of life for inhabitants.
Other popular searches
- Maps Latitude and Longitude
- Maps, Longitude and Latitude
- Longitude & Latitude Maps
- Longitude Latitude Maps
- Maps, Longitude Latitude
- Maps, Latitude/longitude


