Curated OER
How Do Dinosaurs Measure Up?
Students measure and draw to scale, a representation of a dinosaur to practice math skills.
Curated OER
Motherhood Math: Mothers in the Workforce
Students evaluate a table showing how the number of working mothers increased between 1955 and 2000. They use the information from the table to complete a worksheet imbedded in this lesson.
Newspaper Association of America
By the Numbers: Mathematical Connections in Newspapers for Middle-Grade Students
A cross-curricular resource teaches and reinforces mathematical concepts with several activities that use parts of a newspaper. Scholars use scavenger hunts to find the different ways math is used in the paper along with using data...
Roald Dahl
Matilda - Bruce Bogtrotter and the Cake
After reading the 11th chapter in Matilda, class members take on the role of Bruce Bogtrotter and re-enact the cake eating scene. Here's the catch: they must come-up with an impromptu re-enactment of the scene from the story, and...
Teach Engineering
Energy and the Pogo Stick
Let your class bounce to examine the concept elastic potential energy. Individuals bounce on a pogo stick in order to calculate its elastic potential energy. Groups then compare the elastic potential energy to the gravitational...
National Research Center for Career and Technical Education
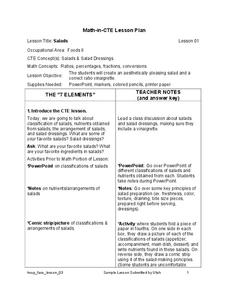
Salads
Lettuce talk for a moment about your culinary scholars; do they have what it takes to create a great salad? Show them the finer points of salad preparation with a career and technology lesson that combines direct instruction, creativity,...
Curated OER
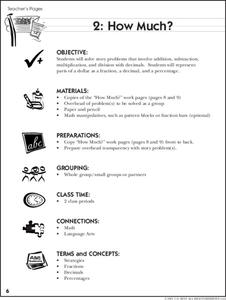
How Much?
It's time to go back over all that your class has learned about decimals, fractions, and percentages! To do so, individuals solve story problems that involve addition, subtraction, multiplication, and division with decimals, explain how...
Curated OER
Explore Surface Types on a Journey Around Earth
Students explore satellite data. In this technology cross-curriculum math and world geography lesson, students locate specific map areas using a microset of satellite data. Students use technology and math skills to determine percentages...
Curated OER
Mathematics & Nutrition
Pupils apply math to calculate fat and calories in the food they eat. They examine food package information to become aware of the ingredients and to learn about healthy life styles. They work in groups to create crazy meals using the...
Curated OER
Scaling Up Art
Students measure a sculpture of a human and measure other students. They determine the average size of humans and create a life size image of the sculpture. They work with percentages as they create the images.
Curated OER
Computation with Fractions
Upper graders are introduced to the topic of fractions and percentages. In groups, they discuss real world situations in which fractions are present, and they complete a worksheet solving problems with common and uncommon denominators....
Curated OER
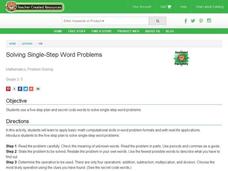
Solving Single-Step Word Problems
Math wizards learn the five-step plan to solve math word problems. They investigate the five-step process for solving word problems, and examine the use of code words for each of the operations and solve a problem using the strategies.
Curated OER
What Can You Do With Money?
Students watch a Biz Kidz video about money, learn what they can do with money, and fill out worksheets on what they learn. Students learn about spending, saving, donating, and investing.
Curated OER
Using Simple Equations To Solve Word Problems
In this math worksheet, students learn to read a word problem, write an equation, solve for the variable and write and label the answer. There are examples given at the top of the page although directions tell students to "use...
The New York Times
Fiction or Nonfiction? Considering the Common Core's Emphasis on Informational Text
Nothing aids in comprehension more than an explanation and understanding of why things are done. Address why the Common Core requires the reading percentages that it established and analyze how this affects your readers. Learners read...
Curated OER
Nutrients by the Numbers
Students read and discuss an article on the amount of sugar in various food products. They compare the nutritional values of food products, calculate their daily intake of nutrients, analyze serving sizes, and compare/contrast their own...
Curated OER
Making Blood!
students research blood's components, and use their math skills to recreate a model of whole blood using commonly found food items.
Curated OER
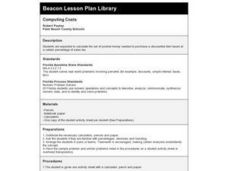
Computing Costs
Seventh graders calculate the out-of-pocket money needed to purchase a discounted item taxed at a certain percentage of sales tax.
Curated OER
How much is a movie worth?
Students discover how much a movie is worth. They use decimals and percentages greater than 100 to complete this activity.
Curated OER
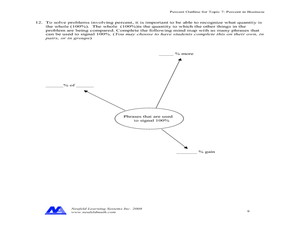
Percent in Business
In this percentages worksheet, students solve word problems that include percentages in business. Students complete 14 word problems.
Curated OER
Skittles Lab
Pupils use Skittles as manipulatives to practice computing decimals from fractions, computing decimals into percentages, and creating bar graphs from gathered data.
Curated OER
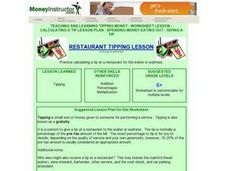
Restaurant Tipping Lesson
What do you do after a good meal, tip the server of course. The class calculates the appropriate tip to leave at a restaurant given certain bills. They identify the bill before and after tax and find the correct tip. A great way to put...
CK-12 Foundation
Interpretation of Circle Graphs: Northwest Region Population Pie
Given populations of the five Northwestern states, learners create a circle graph. Using the data and the pie chart, they make comparisons between the populations of the states. Finally, the pupils determine how the chart will change...
CK-12 Foundation
Types of Data Representation: Baby Due Date Histogram
Histograms are likely to give birth to a variety of conclusions. Given the likelihood a woman is to give birth after a certain number of weeks, pupils create a histogram. The scholars use the histogram to analyze the data and answer...


