Exploratorium
Rotating String Shapes
Here is a very interesting way of studying triangles and polygons. Pupils work together and use pieces of string to create a variety of shapes. Depending on how many kids are manipulating the string at any one time, the number of...
Illustrative Mathematics
The Djinni’s Offer
The djinni in this resource offers gold coins. Learners use the properties of exponents to make their decision as one offer increases exponentially. This makes a great group project. As the commentary suggests, start by having groups...
West Contra Costa Unified School District
Graph Square Root and Cube Root Functions
Scholars first learn to graph square root and cube root functions by creating a table of values. They then learn how to graph functions from transformation of the graphs of the parent square root and cube root functions.
EngageNY
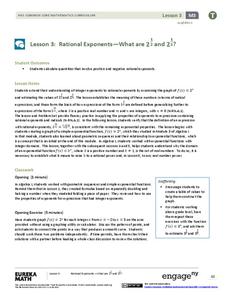
Rational Exponents—What are 2^1/2 and 2^1/3?
Are you rooting for your high schoolers to learn about rational exponents? In the third installment of a 35-part module, pupils first learn the meaning of 2^(1/n) by estimating values on the graph of y = 2^x and by using algebraic...
Alabama Learning Exchange
Building Functions: Composition of Functions
Hammer away at building different types of functions. An engaging activity builds on learners' knowledge of domain and range to create an understanding of composite functions. Young scholars learn to write composite functions...
Beacon Learning Center
Spotted Stones Linked Just Right
Discover how to play the game of dominoes using mental math skills to solve equations that earn points. Pupils become fast critical thinkers in determining which unknown addend tally up points in their favor.
Illustrative Mathematics
Election Poll, Variation 1
Your class will learn what it means to take a random sample of a population and to draw inferences from the information gained. In part a, of the exercise, you discuss with your class how learners during a class election can be best...
Mathematics Vision Project
Module 6: Congruence, Construction, and Proof
Trace the links between a variety of math concepts in this far-reaching unit. Ideas that seem very different on the outset (like the distance formula and rigid transformations) come together in very natural and logical ways. This...
EngageNY
More on Modeling Relationships with a Line
How do you create a residual plot? Work as a class and in small groups through the activity in order to learn how to build a residual plot. The activity builds upon previous learning on calculating residuals and serves as a...
Curated OER
Data Analysis and Probability: Graphing Candy with Excel
Collect and graph data using Microsoft Excel with your math class. They will make predictions about the number of each colored candy in a bag of M&M's, then sort, classify, count, and record the actual data before using Excel to...
Curated OER
Cutting Expenses
Students explore budgeting. In this finance and math instructional activity, students brainstorm ways in which households could save money. Students view websites that give cost reducing ideas. Students complete an expense comparison...
Illustrative Mathematics
Fixing the Furnace
This comprehensive resource applies simultaneous equations to a real-life problem. Though the commentary starts with a graph, some home consumers may choose to begin with a table. A graph does aid learners to visualize the shift of one...
Illustrative Mathematics
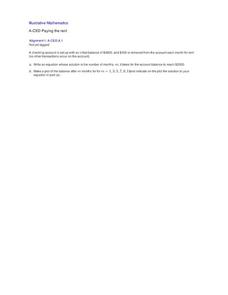
Paying the Rent
Learning how a bank account works is a useful tool. The exercise in the resource is to deduct rent from a checking account and create an equation from a description. Participants then graph the balance of the bank account versus months...
Statistics Education Web
NFL Quarterback Salaries
Use statistics to decide if NFL quarterbacks earn their salaries! Learners study correlation coefficients after using technology to calculate regression equations. Through the data, they learn the meaning of correlation and correlation...
Curated OER
Multi-dimensional Modeling of Ore Bodies Making Sense of Empirical Data
Math scholars identify four different rock types in that strata and use this identification and data to construct a two dimensional geologic cross-section. They use data tables to construct a three-dimensional geologic cross-section.
Curated OER
Energy Conservation
Students investigate energy conservation. In this energy conservation and analyzing data lesson, students identify and explain several energy sources and research renewable and nonrenewable energy sources. Students use statistics...
Curated OER
Buying on Credit
Explore using credit in this financial responsibility and math lesson. Learn to identify the acronym of "PRT" as Principle x Rate x Time, then calculate interest based on this formula. Do some real-world problem solving and choose...
Achieve
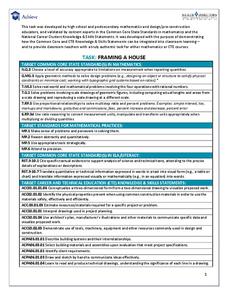
Framing a House
If members of your class wonder where they can use the math they learn in middle school, let them discover the answer. Learners apply geometry concepts of scale and measure to calculate the costs of framing a house addition.
Curated OER
Dental Impressions
What an impressive task it is to make dental impressions! Pupils learn how dentists use proportional reasoning, unit conversions, and systems of equations to estimate the materials needed to make stone models of dental impressions....
EngageNY
Dividing by (x – a) and (x + a)
Patterns in math emerge from seemingly random places. Learners explore the patterns for factoring the sum and differences of perfect roots. Analyzing these patterns helps young mathematicians develop the polynomial identities.
Annenberg Foundation
Geometry 3D Shapes: Test Your Skills
Time to find out what they've learned! The final lesson of a five-part series has learners complete a 39-question multiple choice review. They use what they've learned in the previous lessons to complete questions that include concepts...
Curated OER
Balanced Equations
Help your math class understand variables. This activity is for a visual learner. They will use weights and a balance scale to show how the sides of an equation are equal. Worksheet is included.
EngageNY
Modeling Relationships with a Line
What linear equation will fit this data, and how close is it? Through discussion and partner work, young mathematicians learn the procedure to determine a regression line in order to make predictions from the data.
EngageNY
Sine and Cosine of Complementary Angles and Special Angles
Building trigonometric basics here will last a mathematical lifetime. Learners expand on the previous lesson in a 36-part series by examining relationships between the sine and cosine of complementary angles. They also review the...


