Curated OER
The Art of Interpreting Percent
Ddefine the relationships between fractions, decimals, and percentages in a series of lessons. The class practices converting between these three versions of a number. They also find the common factor of a numerator and denominator and...
Curated OER
Identifying Economic Systems
Young historians practice identifying evidence to categorize a particular country's economic system as either a mixed, centrally planned, traditional, or free economic system in this two-part instructional activity.
Federal Reserve Bank
To Rent-to-Own or Not to Rent-to-Own?
Explore the key elements of a contract with your young adults, and delve into the features and unique benefits of a rent-to-own contract through discussion and worksheet practice.
Curated OER
Budget Making
Students develop a budget for spending and saving. In this economics lesson, students create a budget based on personal, family and government income. They discuss jobs at home and allowances. They discuss how they manage their money...
American Statistical Association
How Fast Are You?
Quick! Snap up the instructional activity. Scholars first use an online app to collect data on reaction times by clicking a button when the color of a box changes. They then plot and analyze the data by considering measures of center,...
Curated OER
Stocking Rate Calculations
Students read the directions and complete a table using information from the introduction to complete this lesson. Using an equation given to them, they calculate the proper stocking rate for cattle and elk. They also calculate a mixed...
Curated OER
Breaking News English: World Population Aging At Record Rate
For this English worksheet, students read "World Population Aging At Record Rate," and then respond to 1 essay, 47 fill in the blank, 7 short answer, 20 matching, and 8 true or false questions about the selection.
Curated OER
Americans Spending at Record Rates
For this Americans spending at record rates worksheet, 8th graders read or listen to an article, discuss money topics, answer 8 true or false, match 10 synonyms, and 10 phrases, fill in 16 blanks, answer 6 short answer questions,...
Curated OER
Express Yourself
Sixth graders write to Key pals. In this description instructional activity, 6th graders describe a place to their key pals and the pal has to draw a pictures based off their description. They also create a Fun Facts Worksheet about...
Curated OER
Pump It Up
Students study the anatomy and functions of a heart. For this heart study lesson, students read a book about the heart and study a plaster heart model. Students take their own pulse in various stages of rest as well as active...
Curated OER
Lesson Exchange: Polygons (Middle, Mathematics)
Students discover the relationship between the sides of a polygon and the number of diagonals that can be drawn from one vertex, the number of triangles that those diagonals form, and the sum of the interior angles of that polygon.
Curated OER
Water - Planning for the Future
Students explore and examine the increases and/or decreases for water user groups: irrigation, municipal, manufacturing, steam electric power generation cooling, livestock, and mining. They utilize percentage changes during their...
Curated OER
A Beating Heart
Learners collect and analyze data using percent difference. In this algebra lesson, students relate the concepts of algebra to cardiac physiology.
Curated OER
Chemical Interactions
Students perform scientific investigations to observe chemical reactions. In this chemical reaction lesson students read a passage and identify the cause and effect.
Curated OER
Water Cycle and Its Movement in the Soil
Students are introduced to the water cycle and water movement in soil. In this water cycle instructional activity, students explore how water moves through the water cycle and discuss water sources, natural reservoirs, soil infiltration...
Curated OER
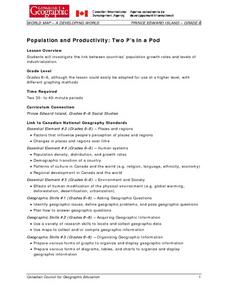
Population and Productivity: Two P's in a Pod
Students investigate the link between countries' population growth rates and levels of industrialization. They observe that, over time, as a country becomes more industrialized, its population growth rate decreases.
Curated OER
You've Got to Be Cool to Make Igneous Rocks
Students describe how igneous rocks are formed, design a classification system to group igneous rocks and develop a controlled experiment to prove that the rate of cooling affects the size of the crystals.
Curated OER
Combien co¿¿te?
Students engage in conversation using the target vocabulary and grammar structure while discussing prices in euro. They also engage in listening and writing skills related to these topics. Finally, students identify and analyze the...
Curated OER
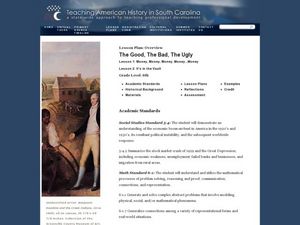
The Good, The Bad, The Ugly
Sixth graders examine the causes of the stock market crash of 1929. In this integrated math/history unit on the stock market, 6th graders study, research, and read stocks, visit a local bank, and create a PowerPoint to show the finished...
Curated OER
Mixing Up Ratios
Students solve problems of ratio and proportions using hands on. In this algebra lesson plan, students vary the concentration of a fruit drink using parts of a ratio.
Curated OER
Force
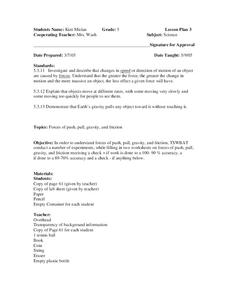
Fifth graders move a variety of objects in different ways to observe the different forces. In this physics lesson, 5th graders observe pushing, pulling, gravity, and friction. The hands-on component, and teamwork involved, should make...
Curated OER
Comparing Ratios
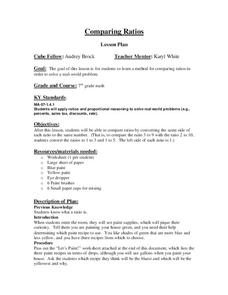
Young scholars solve problems using ratio and proportion. In this math comparison lesson, students identify methods used to solve and compare ratio and proportion in the real world. They apply criss cross multiplying to solve their...
Curated OER
Gravity: It's GREEEAAATTT!
Students calculate effects of gravitational force on planets, discuss the effects of weightlessness on the human body and describe and demonstrate how objects in a state of free fall are accelerated by gravity at an equal rate.
Curated OER
Go Car, Go!
Students design and build their own car. In this physics lesson, students collect data to determine the speed of the car. They plot the data on the graph analyze the relationship between variables.


