Shodor Education Foundation
Algebra Quiz
Reviewing the process of solving equations is as easy as one click of a button. Scholars solve linear and quadratic equations by using a helpful interactive. The computer app automatically scores responses, providing immediate feedback...
Shodor Education Foundation
Linear Inequalities
An interactive lesson helps individuals learn to graph inequalities in two variables. Scholars can adjust the interactive to present the inequalities in standard or slope-intercept form.
Shodor Education Foundation
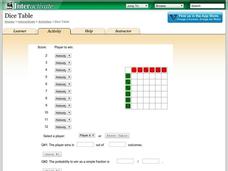
Dice Table
Convert a table to probabilities. Pupils set up the winning rules for the sums of two dice. Using the rules, the applet fills out a table showing the winners for each combination. Learners determine the probabilities of winning for each...
Shodor Education Foundation
Two Variable Function Pump
Use a function to operate on two variables. Pupils look at operating with complex numbers as a function of two variables. The interactive squares the input and adds a constant to it. Learners visualize the resulting output and its...
Shodor Education Foundation
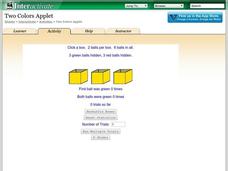
Two Colors Applet
Find the box with two green balls. The applet uses six balls, three green and three red, and hides them in three boxes. Pupils choose a box and click on it to reveal the color of balls inside. Using the chosen box, the simulation keeps...
Shodor Education Foundation
Stem and Leaf Plotter
The key is in the leaves. Pupils enter data to create a stem-and-leaf plot. The resource then displays the plot and calculates the mean, median, and mode of the data. Using the plot and the calculated measures of spread, learners analyze...
California Department of Education
I’m Ready to Work
Get ready to apply yourself! Lesson four in a series of five college and career readiness lessons introduces the basic parts of a job application. Pupils discover the necessity for good references and create a master job application for...
California Department of Education
Workplace Skills
What skills do employers look for in potential employees? Introduce scholars to the skills that pay the bills during the second of six career and college readiness lesson plans. Once they have defined critical 21st-century skills, groups...
California Department of Education
The Next 6 Years
Six years seems like a long time when you're in seventh grade! But, graduation is closer than they think! The sixth and final college and career readiness lesson plan gets scholars focused on the courses they need to take throughout the...
California Department of Education
Exploring Military Career Options
A whole world of career options await in the armed forces! Lesson three in a six-part career and college readiness series introduces eighth grade scholars to military careers. Individuals research the entry requirements for the armed...
Shodor Education Foundation
Function Flyer
Fly through graphing functions with the Function Flyer. Young mathematicians use an interactive to graph different types of functions. A set of exploration questions has users investigate patterns in functions.
Shodor Education Foundation
Whole Number Cruncher
Time to crunch the numbers! Young scholars use an interactive number cruncher to practice operations with whole numbers. They input a number and watch as the number cruncher produces the output and then use the data pairs to determine a...
Shodor Education Foundation
Spinner
Go round and round to compare theoretical and experimental probabilities. Learners set the number of sectors and the number of spins for a spinner. Then, a table displays the experimental and theoretical probabilities of the spinner for...
Shodor Education Foundation
Marbles
Grab some marbles from a bag. The applet simulates drawing marbles from a bag. Pupils determine the number of four colors of marbles in a bag and how many marbles to draw. Using information on whether order matters in the draw and if...
Shodor Education Foundation
Plop It!
Build upon and stack up data to get the complete picture. Using the applet, pupils build bar graphs. As the bar graph builds, the interactive graphically displays the mean, median, and mode. Learners finish by exploring the changes in...
National Museum of the American Indian
To Honor & Comfort Native Quilting Traditions
"Native American history leaps boldly off the colorful quilts and patchwork designs." Learners discuss Native American identity and symbolism by reading about a variety of Native quilters and their unique art process, and participate in...
Curated OER
Nuclear Chemistry Project
Radiation has numerous real-world applications, some of which are relatively safe while others can be extremely hazardous. In this nuclear chemistry project, young scientists choose a practical use of nuclear reactions to research in...
Chicago Botanic Garden
Causes and Effects of Climate Change
It's time for your class to literally show what they know! Pupils illustrate what they learned about the causes and effects of climate change by filling out a graphic organizer to complete the 5-part series of lessons. They discuss them...
Chicago Botanic Garden
GEEBITT (Global Equilibrium Energy Balance Interactive TinkerToy)
Students use the GEEBITT excel model to explore how global average temperatures are affected by changes in our atmosphere in part two of this series of seven lessons. Working in groups, they discuss, analyze graphs, and enter data to...
Shodor Education Foundation
Derivate
Derive tangent lines through derivatives. Scholars use an app to graph functions and investigate derivatives and tangent lines. The interactive automatically graphs a tangent line at a specified point and can also produce tables of values.
Shodor Education Foundation
Data Flyer
Fit functions to data by using an interactive app. Individuals plot a scatter plot and then fit lines of best fit and regression curves to the data. The use of an app gives learners the opportunity to try out different functions to see...
Shodor Education Foundation
InteGreat!
Take a great look at integration! Young scholars use an interactive to learn how to integrate a function. Learners input a function and view the integral as well as see a graphical representation.
Shodor Education Foundation
Graphit
No graphing calculator? No worries, there's an app for that! Young mathematicians use an app to graph functions. In addition, they can also plot data points.
Shodor Education Foundation
Conic Flyer
Graphing conics made easy. Individuals use an interactive to graph conic sections. The app can handle circles, vertical and horizontal parabolas, ellipses, and vertical and horizontal hyperbolas.


