Curated OER
Univariate Data Analysis
Students use given data to compare baseball players. They create box and whisker plots to compare the players and determine which they feel is the best player. Students use calculators to make box and whisker plots. They write paragraphs...
Curated OER
Evidence of Change Near the Arctic Circle
Students analyze graphs and make conclusions about climate change. In this climates lesson students produce graphs and identify relationships between parameters.
Curated OER
Radioactive Simulations
Students simulate radioactive decay and nuclear power using an on line interactive web site. In this on line lesson plan, students monitor radioactive isotopes and record the activity of a particular element as the decay progresses. They...
Curated OER
Who's got the fastest legs?
Students use a stopwatch to collect information for a scatterplot. In this fastest legs lessons, students collect data through the taking of measurements, create and find a median number. Students develop an equation and answer...
Curated OER
Exploring Linear Equations And Scatter Plots - Chapter 5 Review
Young scholars complete rolling stocks experiment, and collect and enter data on the computer. They enter data on graphing calculators, complete scatter plot by hand with line of best fit, and discuss different graphing methods.
Center Science Education
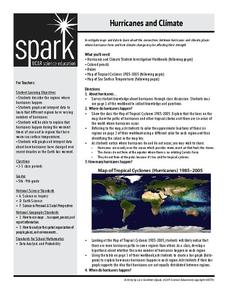
Hurricanes and Climate
Feeling under the weather? This lesson on hurricanes can whip things up! With professionally designed maps and handouts, teach your future weathermen (or women) where, when, and how hurricanes occur. They identify hurricane regions and...
Curated OER
Pumpkin Play
Have you ever examined a pumpkin and estimated the number of lines it has? In this math lesson, students count the actual number of lines, record and graph the results. They investigate the circumference, weight and buoyancy of the...
Curated OER
Move It
Studens collect and graph data. In this algebra lesson plan, students use a CBL and CBR with a TI Calcualtor to observe linear graphs. They use the correct vocabualry as they discuss the collected data.
Curated OER
Algebraic Thinking - Equations
Fifth graders explore equality and inequality by participating in a Tilt/Balance activity. The students listen to the story "Lemonade for Sale" by Stuart J. Murphy and use equations to graph lemonade sale profits.
Curated OER
Saving Money Through Mathematics
Third graders discuss light sources and collect data about energy sources. They compare data and create a multiple line graph showing energy used by light sources for each student in the group. They present their graphs and write a...
Curated OER
Comparing Pulse Rates
Young scholars participate in a lab that demonstrate one example of how the human body maintains homeostasis. Students collect data from themselves and observe how their own bodies react to exercise.
Curated OER
Dental Detectives
First graders explore the theme of dental health and hygeine. They make tooth loss predictions, count lost teeth, and graph tooth loss. In addition, they listen to dental health stories, read online stories, create spreadsheets, and play...
Curated OER
Pen Pals
Students collect bird count data at their sites, and share and compare the data collected from two different schoolyards using computer technology.
Curated OER
Halloween Graphitti
Learners complete multi-curricular activities in a Halloween themed lesson. In this Halloween lesson, students examine newspaper ads to find prices of pumpkins and use them to complete a stem and leaf plot. Learners find the diameter,...
Curated OER
Changing Rocks
Young scholars shake a box containing Plaster of Paris "rocks", gravel, and sand, to measure the effects of erosion. They work individually during this exercise. This task assesses students' abilities to make simple observations,...
Curated OER
An Interdisciplinary Deer and Human Population Study
Students answer the question, "What environmental problems arise due to animal and human overpopulation and what might need to be done to combat these problems?" They play games, graph data and write proposals about the question.
Virginia Department of Education
A-Mazing Plants
Have your young scientists questioned why plants grow a particular way? Through this learning opportunity, scientists gain firsthand knowledge about how plants develop and various factors that affect rates of growth as they bring plants...
Curated OER
The Election Connection
Students participate in a mock election. In this election lesson, students vote online in a mock election, graph the results, and compare their results to the nationwide results.
Curated OER
Meats Make Muscles
Second graders explore the meat group of the food pyramid. In this nutrition and diet activity, 2nd graders study the benefits of eating foods in the meat group, collect data regarding their classmates' favorite foods, and create a graph...
Curated OER
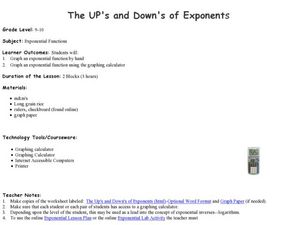
The UP's and Down's of Exponents
Young scholars explore the concept of exponents. In this exponential functions worksheet, students complete provided worksheets that require them to graph exponential functions by hand as well using graphing calculators.
Curated OER
What Are Erosion and Sediments?
Middle schoolers create experiments in class based on the erosion of Earth. In this erosion lesson, students perform a lab in class replicating the effects of erosion. Middle schoolers finally draw their own conclusions based on the...
Curated OER
Human Effect
Students investigate changes in air quality. In this science lesson, students compare data to determine the air quality. Students explore how humans affect the air quality.
Curated OER
Observing Properties of Matter
Third graders explore matter. In this physical science lesson, 3rd graders observe several items and use their five senses to describe their properties. Students record their observations and share with the class.
Curated OER
Education for Global Peace
Fifth graders construct data graphs based upon sets of data. In this graphing instructional activity, 5th graders read the text If the World Were a Village and discuss how types of graphs accurately represent a large population. Students...


