Curated OER
The Viewing Tube
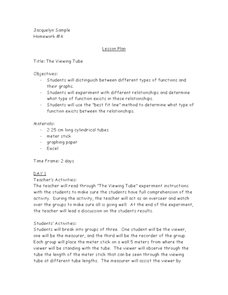
Looking for an excellent lesson that incorporates math, science, and technology? Groups of three students use a viewing tube to perform an experiment, and discover how to organize their data into an Excel spreadsheet. This is a very...
Statistics Education Web
Using Dice to Introduce Sampling Distributions
Investigate the meaning of a sample proportion using this hands-on activity. Scholars collect data and realize that the larger the sample size the more closely the data resembles a normal distribution. They compare the sample proportion...
Chicago Botanic Garden
GEEBITT (Global Equilibrium Energy Balance Interactive TinkerToy)
Students use the GEEBITT excel model to explore how global average temperatures are affected by changes in our atmosphere in part two of this series of seven lessons. Working in groups, they discuss, analyze graphs, and enter data to...
Kenan Fellows
Half-Life
Scholars shake their way to understanding half-life with the help of candy. They observe and record which side candy lands on to graph the exponential decay in the fifth lesson of seven integrating chemistry and algebra. Combining...
Curated OER
Yummy Math
Young mathematicians use bags of Skittles to help them gain practice in graphing and organizing data. They work in pairs, and after they have counted and organized their Skittles, they access a computer program which allows them to print...
Statistics Education Web
Sampling in Archaeology
Compare different random sampling types using an archaeological setting. Scholars collect data from an archaeological plot using simple random samples, stratified random samples, systematic random samples, and cluster random samples....
Illustrative Mathematics
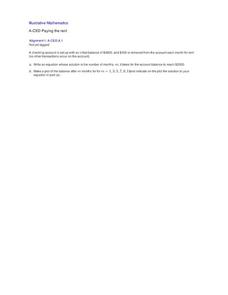
Paying the Rent
Learning how a bank account works is a useful tool. The exercise in the resource is to deduct rent from a checking account and create an equation from a description. Participants then graph the balance of the bank account versus months...
Curated OER
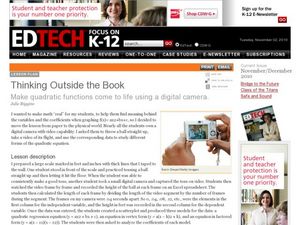
Thinking Outside the Box
Now this lesson sounds fun! Students throw a ball, film it as it soars through the air, and use a spreadsheet to collect data. A scatterplot is created to produce a quadratic regression equation, an equation in vertex form, and an...
Curated OER
Come On Down!
Begin with an introduction to famous deep-sea submersibles. Learners work in groups to gather information on different vessels and then share with the class. Each group then uses water displacement to help calculate the density of...
EngageNY
Comparing Linear and Exponential Models Again
Making connections between a function, table, graph, and context is an essential skill in mathematics. Focused on comparing linear and exponential relationships in all these aspects, this resource equips pupils to recognize and interpret...
Curated OER
Let's Graph It!
Students graph the height of others in centimeters and inches, find the slope of line in order to calculate the conversion factor between centimeters and inches.
Curated OER
The Bigger they Are . . .
Pupils do a variety of data analyses of real-life basketball statistics from the NBA. They chart and graph rebounding, scoring, shot blocking and steals data which are gathered from the newspaper sports section.
Curated OER
Walking the Plank
Eighth graders experiment with a bathroom scale, books and a plank to determine how weight readings change as distance is applied. They graph and interpret the results.
Curated OER
Confusing Colors!
Fourth graders collect data, graph their data, and then make predictions based upon their findings. They's interest is maintained by the interesting way the data is collected. The data collection experiment is from the psychology work of...
Curated OER
Bungee M&M's
Eighth graders experiment with M&M's and a cup attached to a spring to to simulate a bungee jump. They graph the results of the experiment and make predictions for continuing the experiment. They determine the "line of best fit."
Curated OER
Opening the Case
Students participate in a class survey and then design an experiment and use graphs and statistics to assist them in solving a problem. They organize the results of the survey in a stem-and-leaf plot and find the range, median, mean, and...
Curated OER
Graphing
Fifth graders create graphs based on climate in South Carolina. They read and interpret information in a chart and construct a graphy from the information in the chart. They create a spreadsheet using Excel and publish 2 graphs.
Curated OER
What's Your Favorite Planet?
Fourth graders interpret a graph and make correlations using data. After taking a class survey, 4th graders create a class graph of their favorite planets. Working in small groups, they interpret the information and create at least ten...
Curated OER
Fishing Line Tests
Students test the strength of fishing lines. In this stress test lesson, students will investigate the breaking point of various fishing lines and graph the results.
Curated OER
Viewing Tubes
Students complete a lab in order to discover if the length of a viewing tube, its diameter, or the distance from an object affect the type of data collected and the resulting graph.
Curated OER
Census Data and New Hampshire History
Students graph the population growth of New Hampshire using historical census data.
Curated OER
Estimating Turtle Size and Age
Students investigate how to estimate the age and size of turtles, and examine variability in scientific data. They read an informational handout, identify the parts of the shell, measure the shell and estimate the age, and record the...
Curated OER
Graphing Current Drug Data
Students increase understanding of the drug issue and further develop skill in graphing.
Curated OER
Cloud Observation and Graphing
Students identify the three major cloud groups. They are introduced to the three main cloud types and spend a week making and recording observations of clouds. Students produce a graph that presents their findings and conduct research...


