American Statistical Association
Scatter It! (Predict Billy’s Height)
How do doctors predict a child's future height? Scholars use one case study to determine the height of a child two years into the future. They graph the given data, determine the line of best fit, and use that to estimate the height in...
Illustrative Mathematics
Latitude
The greater the latitude, the less of the Earth is north. Scholars graph the relationship between the latitude and the percentage of the Earth that is north of the latitude. Using the graph and the table, class members interpret values...
David Pleacher
Candy Math Fun
Few things can motivate children to learn like the promise of a sweet and tasty treat. Given a bag of M&M®s, Skittles®, or other colorful candy, students first predict the contents of the bag before counting the pieces, creating a...
Mathed Up!
Inequalities Regions
Discover how to solve systems of inequalities by graphing. An informative video shows pupils how to determine the solution set after graphing each inequality of a system. To finish, a activity gives them a chance to practice this skill.
American Statistical Association
You and Michael
Investigate the relationship between height and arm span. Young statisticians measure the heights and arm spans of each class member and create a scatter plot using the data. They draw a line of best fit and use its slope to explain the...
EngageNY
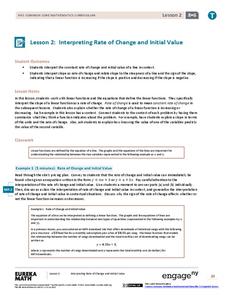
Interpreting Rate of Change and Initial Value
Building on knowledge from the previous lesson, the second lesson in this unit teaches scholars to identify and interpret rate of change and initial value of a linear function in context. They investigate how slope expresses the...
EngageNY
Why Call It Tangent?
Discover the relationship between tangent lines and the tangent function. Class members develop the idea of the tangent function using the unit circle. They create tables of values and explore the domain, range, and end behavior of the...
Curated OER
Birds' Eggs
More than just data, scatter plots are full of information that can be used to answer a variety of questions. This lesson uses a plot with information about bird egg sizes to answer questions about the relationship between length and...
Teach Engineering
Linear Regression of BMD Scanners
Objects may be more linear than they appear. Scholars investigate the relationship between the number of bone mineral density scanners in the US and time. Once they take the natural logarithm of the number of scanners, a linear...
Curated OER
Expressing Geometric Properties with Equations
Algebra and geometry are not interchangeable. Demonstrate why not with a series of problems that deal with the equations of circles and equations of lines that meet specific criteria.
Mathematics Vision Project
Modeling Data
Is there a better way to display data to analyze it? Pupils represent data in a variety of ways using number lines, coordinate graphs, and tables. They determine that certain displays work with different types of data and use two-way...
Chemistry Collective
Virtual Lab: Determination of the pH Scale by the Method of Successive Dilutions
Where did the pH scale come from? Take a deeper look at a most important measure of ion concentration using a simulated physical determination. Young chemists prepare a series of dilutions after determining a dilution factor for the...
Flipped Math
Equations of Lines in the Coordinate Plane
What, you mean there is algebra in a Geometry class? Pupils review graphing and writing the equations of lines in slope-intercept form. The instruction follows the "I do, we do, you do" framework of a lesson. The instructor first...
EngageNY
Comparing Irrational Numbers
Build on your classes' understanding of irrational numbers by comparing their values. The 13th lesson in the 25-part module has individuals estimate values of both perfect and non-perfect roots. They finish by graphing these numbers on a...
CPO Science
Science Worksheets
If you need an array of worksheets to augment your science lessons, peruse a collection of assignments that is sure to fit your needs. With topics such as metric conversion, the scientific method, textbook features, research skills,...
Math Drills
Thanksgiving Cartesian Art: Mayflower
How did the Pilgrims arrive to America? Middle schoolers graph ordered pairs on a coordinate system, connect the points, and discover a mystery picture—the Mayflower.
Virginia Department of Education
Scatterplots
Math is all fun and games with this activity! Learners use an activity designed around hula hoops to collect data. They create scatter plots with their data and then analyze the graphs for correlation.
US Department of Commerce
Featured Activity: Population Change Over Time
Keep track of a state's population. After a brief discussion on how population data is used for funding, individuals look at population changes over time. Pupils find the population of two states using three different censuses. They then...
Balanced Assessment
Who's Left?
If you're not right-handed, are you wrong-handed? Young statisticians calculate the percentage of left-handed people using a given data set in the assessment task. They plot data on a scatter plot and consider how the line of best fit...
Shodor Education Foundation
Multiple Linear Regression
You'll have no regrets when you use the perfect lesson to teach regression! An interactive resource has individuals manipulate the slope and y-intercept of a line to match a set of data. Learners practice data sets with both positive and...
University of Colorado
Distance = Rate x Time
Every year, the moon moves 3.8 cm farther from Earth. In the 11th part of 22, classes use the distance formula. They determine the distance to the moon based upon given data and then graph Galileo spacecraft data to determine its movement.
Laboratory for Atmospheric and Space Physics
Star Light, Star Bright
Star light, star bright, first star I see ... wait a minute, where did the star go? Scholars complete a simulation that measures the brightness of a distant star as another object passes in front of it. Learners move the passing object...
CK-12 Foundation
Determining the Equation of a Line: Temperature Conversion Challenge
Line up the temperature conversions. Pupils create the linear function between Celsius and Fahrenheit on a graph by plotting the freezing and boiling points of water. The scholars determine how the relationship changes based upon...
CK-12 Foundation
Graphs of Linear Functions: Line Designs
Designs from lines are sublime. Scholars create colorful designs by connecting points on an interactive coordinate plane. They answer questions about slope and quadrants based on their designs.
Other popular searches
- Double Line Graphs
- Graphs. Line Graphs
- Bar and Line Graphs
- Interpreting Line Graphs
- Making Line Graphs
- Reading Line Graphs
- Analyzing Line Graphs
- Creating Line Graphs
- Number Line Graphs
- Reading Double Line Graphs
- Straight Line Graphs
- Bar Graphs Line Graphs


