Curated OER
Generate Measurement Data Word Problems
Beginning graphers will appreciate this practice with basic bar graphs. For each table of data, there is a corresponding graph for learners to match it to. The five data sets all have the same two...
Curated OER
Race, Education, and Income: Comparing Carter & Reagan
High school learners compare economic outcomes for 3 racial groups under the presidencies of Jimmy Carter and Ronald Reagan by analyzing a series of graphs, answering questions from a worksheet, and participating in a discussion.
Curated OER
Classroom Supplies
Challenge young mathematicians to buy classroom supplies by staying within the means of a $1,000 budget. The mathematical activity provides learners with the opportunity to decide what items from the supply list would benefit a class of...
Curated OER
Ordering Integers
Sixth and seventh graders compare and order integers. After locating integers in a newspaper, they describe examples of negative and positive integers. They draw a thermometer and locate positive and negative integers on the scale. In...
Curated OER
Charting Attendance Rate of Busch Gardens
Sixth graders, in groups, are given different parts of the whole project. They use information from Busch Gardens to explore line graphs, averages, and other math vocabulary.
Curated OER
Charting Weight
Sixth graders record the weight of themselves and 3 family over a week, and then use that data to compile 2 bar graphs and 4 line graphs and answer a series of questions.
Curated OER
No Title
Sixth graders, after reviewing and studying the basics of recording, analyzing and presenting data, create on graph paper a bar or line graph to represent given data and then interpret the data. They answer questions about the given data...
Curated OER
Hands On: Make Predictions
In this making predictions activity, students use the line graph for marble numbers and colors to help them answer the questions about making predictions.
Curated OER
Analyzing Equations Through Slope and Y-int
With problems applying to modern-day topics like Netflix and McDonald's, math whizzes analyze graphs and investigate the slopes. In this algebra worksheet, learners identify the slope and y-intercept of the given equations. They graph...
Curated OER
Mathemafish Population
It's shark week! In this problem, young mathematically minded marine biologists need to study the fish population by analyzing data over time. The emphasis is on understanding the average rate of change of the population and drawing...
Alabama Learning Exchange
Building Functions: Inverse Functions from Tables and Graphs
Is the inverse a function? Scholars learn how to examine a function to answer this question. Using an online interactive, they examine the properties of inverse functions to compare to the original function.
CK-12 Foundation
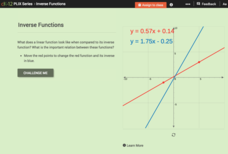
Inverse Functions
Provide a graphical view of inverses. Pupils manipulate points on a line and see the relationship of the graph with the graph of its inverse. Using the relationship between the graphs, scholars respond to questions concerning inverses...
Natinal Math + Science Initative
Slope Investigation
Context is the key to understanding slope. A real-world application of slope uses a weight loss scenario with a constant rate of change to introduce the concept of slope of a line, before it makes a connection to the ordered pairs...
Curated OER
Is Portland, Oregon Experiencing Global Warming?
Students use data to determine if the climate in Portland has changed over the years. In this weather lesson students complete line graphs and study long wave radiation.
Kuta Software
One-Step Inequalities
Here's a simple activity on solving and graphing inequalities for your algebra class. Learners solve 24 questions, graphing each on a number line. Numbers include fractions, integers, and negative numbers.
CK-12 Foundation
Intercepts by Substitution: Finding a Linear Product Using a Quadratic
Discover another way to interpret multiplication. Using an interactive, learners slide points (representing the factors of multiplication) along the x-axis of the graph of y = x^2 and observe changes in the line segment connecting the...
CK-12 Foundation
Existence: One-to-One Functions and Inverses
One-to-one means the answer is simple, right? Given four graphs, pupils use a vertical line to test each graph to find out if they are one-to-one. By using the resource, learners realize that not all one-to-one relations are functions....
Illustrative Mathematics
Random Walk III
Don't cross the line; just walk along it. Scholars investigate a scenario in which a person starts at zero on a number line, then moves left or right depending on a flip of a coin. They determine the number of outcomes for six flips,...
EngageNY
Motion Along a Line – Search Robots Again
We can mathematically model the path of a robot. Learners use parametric equations to find the location of a robot at a given time. They compare the paths of multiple robots looking for parallel and perpendicular relationships and...
National Council of Teachers of Mathematics
Geogebra: Residuals and Linear Regression
If the line fits, use it. Using a Geogebra interactive, pupils plot points and try to find the best fit line. They assess the linear fit by analyzing residuals. A radio button allows participants to show the regression line and the...
University of California
Seasons Lab Book
Unlock the mystery behind seasonal change with a collection of worksheets and activities. Whether they are drawing pictures of Earth's orbit around the sun or graphing the temperature and daylight hours of different locations...
CK-12 Foundation
Inverse Functions: Definition of Inverse Functions
Is the inverse of a function also a function? Pupils manipulate the graph of a function to view its inverse to answer this question. Using a horizontal and vertical line, class members determine whether the initial function is...
Flipped Math
Reflections
Take some time to reflect on graphing. Learners count a point's distance from the line of reflection to create reflections of geometric figures. Given the rules for four basic lines of reflections, pupils determine the points to create...
Flipped Math
Calculus AB/BC - Reasoning Using Slope Fields
Find a solution in the field. An informative video presentation shows pupils how to use the information from a slope field to sketch the graph of a particular solution to a differential equation. Individuals learn how to determine the...
Other popular searches
- Double Line Graphs
- Graphs. Line Graphs
- Bar and Line Graphs
- Interpreting Line Graphs
- Making Line Graphs
- Reading Line Graphs
- Analyzing Line Graphs
- Creating Line Graphs
- Number Line Graphs
- Reading Double Line Graphs
- Straight Line Graphs
- Bar Graphs Line Graphs


