Curated OER
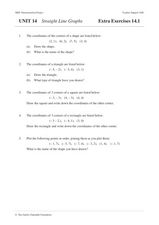
Straight Line Graphs
In this math worksheet, students plot lines on a graph paper when given the equation for the line in slope-intercept form. They tell the values of the slope and the y-intercept. Students find the x and y intercepts and plot three lines....
Curated OER
Graphing Activity
In this probability and statistics worksheet, students work with a family member to construct graphs based on real life data. The two page worksheet contains three questions. Answers are not included.
Curated OER
Mystery Graphs
Pupils study graphs and learn how to display information into a graph. In this graph lesson plan, students construct a graph of their own sorted data, and pick out things in graphs that are inconsistent.
Illustrative Mathematics
Walk-a-thon 1
Your mathematician's job is to explore the relationship between hours and miles walked during a walk-a-thon. The activity compels your learners to experiment with different means in finding out this proportional relationship. The answer...
Curated OER
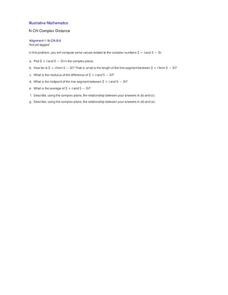
Complex Distance
Have learners graph complex numbers to gain a visual and mathematical understanding of the distance and the midpoint between two complex numbers. This lesson is short, but to the point, and addresses an important complex number concept....
Curated OER
MAP Practice
In this geometry activity, students create circle, line and bar graphs using different comparisons of events. There are 24 questions with an answer key.
Curated OER
Investigating Linear Equations Using Graphing Calculator
Students investigate linear equations using the Ti-Calculator. In this algebra lesson, students graph lines and identify the different quadrants on a coordinate plane. They identify ordered pairs used to plot lines.
Curated OER
Graphing Linear Equations Using the Table Method
Young scholars graph linear equations using a table. For this algebra lesson, students create a table of values using the linear equation to find the y-values. They plot their point on a coordinate plane and graph the line.
Curated OER
Reading Graphs
Students plot functions on the Cartesian coordinate plane. They explore lines and parabolas. Students analyze graphs and answer questions about the information presented on the graph using an online program.
Curated OER
Graphing Integers
Fifth graders complete an integer graphing activity. In this integer graphing lesson, 5th graders use coordinate grids to help them complete linear functions and integer graphing.
Curated OER
Coordinate Graphs, Translations and Reflections
Students perform translations and reflections. In this algebra lesson, students use the TI calculator to graph functions. They move the functions around on the coordinate plane using translation and reflection.
Curated OER
Coordinate Graphs
Students use coordinate graphs in order to identify objects and their locations. They are shown how to plot the x and y coordinates and then are given values to be plotted during guided and independent practice. Students are assessed on...
Curated OER
Plot the x-y Coordinates on the Grids Below
In this coordinate grid graphing worksheet, students plot the given points onto each of 6 coordinate grids. All points are located in quadrant 1. One point is plotted on each grid. Answers are given by clicking the appropriate place on...
Curated OER
Family Activity: Bar Graphs and Line Graphs
In this math worksheet, students work at home with a family member on a graphing activity. Students count the number of cans, glass jars, boxes and bags in the pantry. Students make a bar and a line graph to represent the data.
Curated OER
Finding Slope of a Line
Students calculate the slope of a line. For this algebra lesson, students graph a line using the slope and y-intercepts. They define the steepness of the line using the slope.
Curated OER
Graphing Inequalities
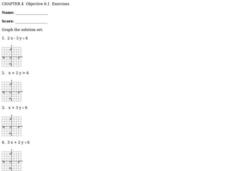
In this graphing inequalities worksheet, students solve and graph the solution set for eight inequalities. They first solve each inequality, either for x or for y, then they plot the coordinates found on the graph provided for each...
Curated OER
Using Graphs
For this using graphs worksheet, 9th graders solve and complete 6 different types of problems. First, they determine how the transformation shown moves the graph. Then, students find the interval that is defined given the coordinates....
Curated OER
Read, Recognize & Graph Integers
Students explore negative and positive integers on a number line. They review a newspaper to determine careers that use positive and negative integers. In groups, they read and answer questions on "Lifestyles of the Rich and...
Curated OER
Real Life Graphs
In this real life graphs activity, students examine graphs and determine the equation of a line. They interpret distance time graphs and draw graphs to match a real life situations. This three-page activity contains 3 multi-step problems.
Curated OER
Immigration Graphs
Fourth graders study immigration. In this graphing lesson, 4th graders make a population graph of people who have immigrated to Indiana.
Curated OER
More On Graphing Linear Equations
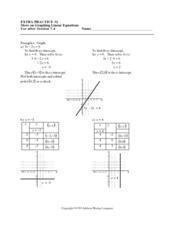
In this linear equation worksheet, students graph linear equations and identify the x or y-intercept. There are nine graphing equations on this two-page worksheet.
Curated OER
Who's got the fastest legs?
Students use a stopwatch to collect information for a scatterplot. In this fastest legs lessons, students collect data through the taking of measurements, create and find a median number. Students develop an equation and answer...
Curated OER
Math Lesson: What Do You Want to Know? - Country Statistics
Students are able to identify the characteristics of a variety of graphs (i.e. bar graph, line graph, pie graph, scatter plot, population pyramids, etc.) They recognize how the type of data to be presented plays a role in choosing the...
Curated OER
Graphing Linear Equations
Ninth graders review the information that they have already learned
with regard to linear equations and graphical representations. They then assist in combining equations with a graphical element and complete various graphs with this...


