Cuemath
Cuemath: Line Graphs
A comprehensive guide for learning all about line graphs with definitions, their sections, how to read and create graphs, solved examples, and practice questions.
Khan Academy
Khan Academy: Creating Dot Plots
Practice creating dot plots. Dot plots are very similar to frequency tables, but they make it easier to see the data. Students receive immediate feedback and have the opportunity to try questions repeatedly, watch a video or receive hints.
Quia
Ixl Learning: Dot Plots
Brush up on your math skills relating to dot plots then try some practice problems to test your understanding.
University of Regina (Canada)
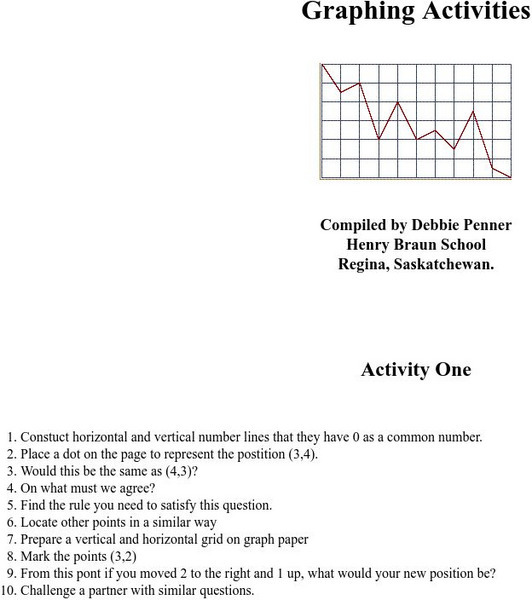
University of Regina: Math Central: Graphing Activities
Eighteen different graphing activities will teach students how to plot points, draw lines, compare graphs, and problem solve.
University of Regina (Canada)
University of Regina: Math Central: Graphing Activities
Eighteen different graphing activities will teach students how to plot points, draw lines, compare graphs, and problem solve.
Mangahigh
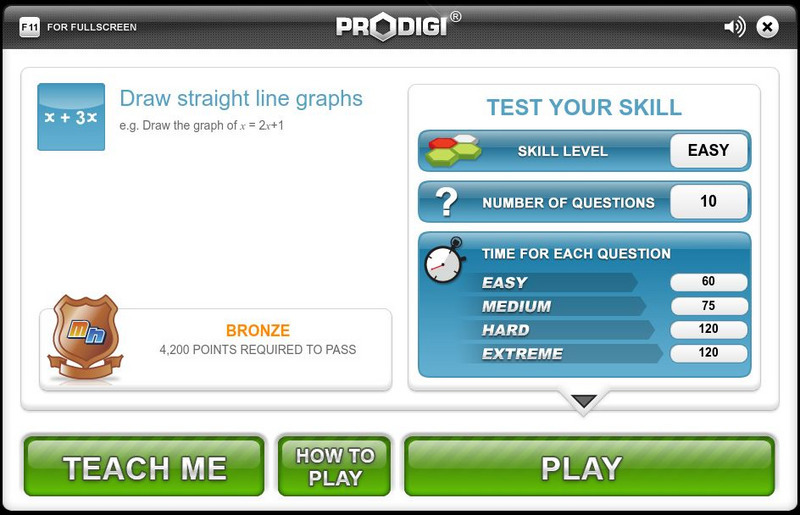
Mangahigh: Algebra: Draw Straight Line Graphs
Mangahigh is a website with math games aimed at twelve to eighteen year olds. On this site students plot graphs of explicit linear functions.
Alabama Learning Exchange
Alex: Great Golly Graphs
This lesson plan asks learners to create a survey project including graphs, questions, tables, and data analysis. It gives an assessment and ideas for remediation and extension as well as ways to manage behavior problems and reluctant...
BBC
Bb Ci: Exponential Graphs (Higher)
Exponential graphs increase rapidly in the Y direction and will never fall below the X -axis, thus forming a curve.
Oswego City School District
Regents Exam Prep Center: Scatter Plots and Line of Best Fit
Use this lesson, practice exercise, and teacher resource in planning instruction on scatter plots and line of best fit. In the lessons, you'll find definitions and examples of ways to make a scatter plot, determine correlations, and find...
Other
Online Statistics Education: Graphing Distributions [Pdf]
This is the second chapter of a statistics e-text developed collaboratively by Rice University, University of Houston Clear Lake, and Tufts University. It looks at many different types of data displays and the advantages and...
National Council of Teachers of Mathematics
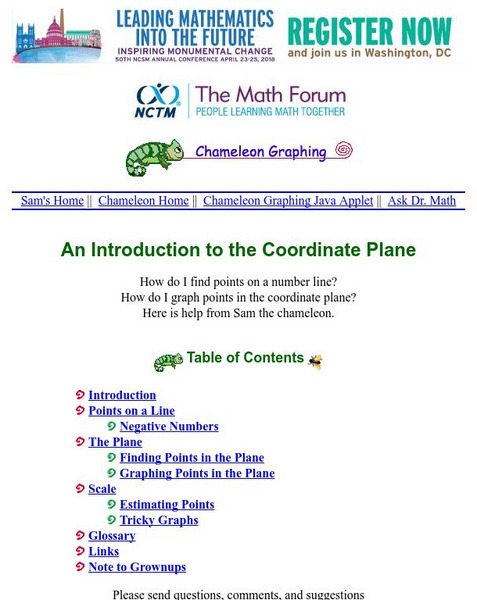
The Math Forum: Chameleon Graphing: Coordinate Plane
Dive into this introduction to graphing in the coordinate plane, and meet a chameleon named Sam. Sam will help guide you through graphing points on a line, using negative numbers, and graphing points in the coordinate plane.
Mangahigh
Mangahigh: Data: Trend Graphs
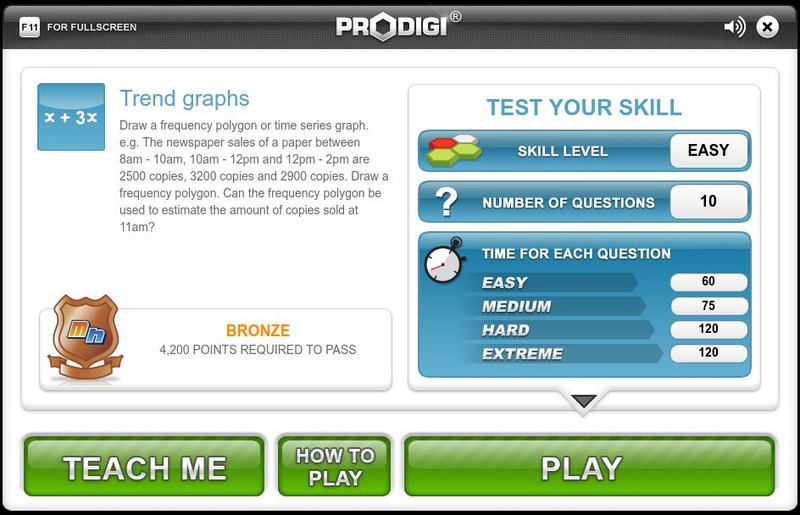
Students explore the concept of frequency trend graphs by working through an online tutorial and then attempting a ten question quiz that increases in difficulty as questions are answered correctly.
Khan Academy
Khan Academy: Make Bar Graphs 1
Practice creating bar graphs (bar charts) from data sets. Students receive immediate feedback and have the opportunity to try questions repeatedly, watch a video or receive hints.
US Department of Education
National Center for Education Statistics: Create a Graph Tutorial
This tutorial walks students through how to create different types of graphs using the Create a Graph tool available on the website. Covers bar graphs, line graphs, pie charts, area graphs, scatter plots, and dependent and independent...
Cuemath
Cuemath: Linear Graph
A comprehensive guide for learning all about linear graphs with definitions, properties, their equations, how to plot or analyze them, solved examples, and practice questions.
CK-12 Foundation
Ck 12: Statistics: Scatter Plots on the Graphing Calculator
[Free Registration/Login may be required to access all resource tools.] This lesson covers finding the equation of best fit using a graphing calculator.
Khan Academy
Khan Academy: Eyeballing the Line of Best Fit
Students practice informally graphing a line of best fit to a scatter plot and answer questions to determine if a scatter plot has a correlation. Students receive immediate feedback and have the opportunity to watch a video, get hints,...
CK-12 Foundation
Ck 12: Algebra: Fitting Lines to Data
[Free Registration/Login may be required to access all resource tools.] Make a scatter plot of data and find the line of best fit to represent that data.
CK-12 Foundation
Ck 12: Algebra: Quadratic Functions and Their Graphs
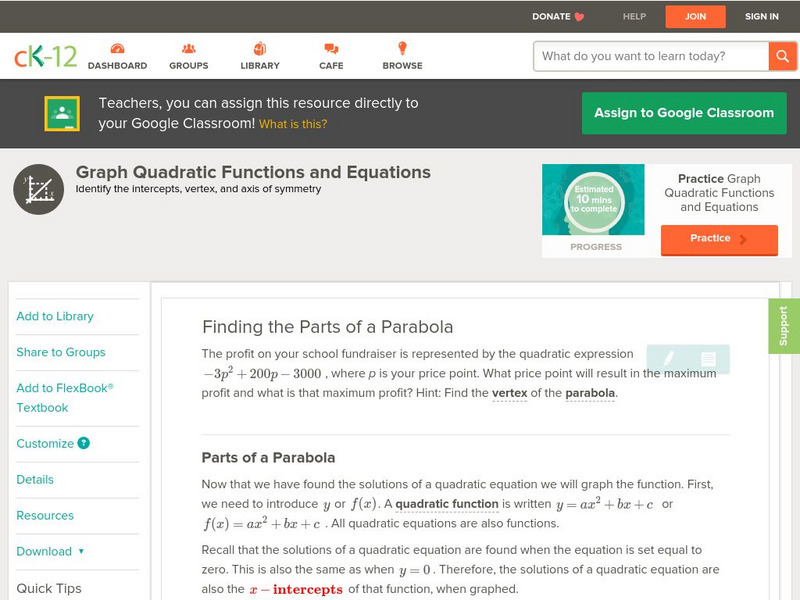
[Free Registration/Login may be required to access all resource tools.] Learn the anatomy of the graph of a quadratic function.
National Council of Teachers of Mathematics
Nctm: Illuminations: Line of Best Fit
Use this activity to practice how to enter a set of data, plot the data on a coordinate grid, and determine the equation for a line of best fit.
University of Illinois
University of Illinois: Line Graphs
Line graphs are shown and explained here. You can learn what kind of data is best represented using a line graph. There are also line graphs with questions and answers available to help you learn how to read them.
The Franklin Institute
Frankin Institute Online: Group Graphing
This site from The Franklin Institute explores how to make a simple graph using a spreadsheet to portray survey data. It also gives a set of interesting sports-related web sites so that students can get statistical inforamtion.
University of Waterloo (Canada)
Univ. Of Waterloo: Wired Math: Linear Graphing: Graphing and Analyzing [Pdf]
The mathematics resource assesses students on linear relations. The activity has problems with graphing and analyzing linear relations. Some of the topics included are variation, scatter plots and linear relationships. The worksheet has...
Khan Academy
Khan Academy: Plotting Inequalities
Create number line graphs of inequalities. Students receive immediate feedback and have the opportunity to try questions repeatedly, watch a video or receive hints.


