Curated OER
Algebra Nomograph
Investigation of a nomograph teaches students to determine the rule of a function by examining the input and output values. Students use a nomograph on their Ti-Nspire to determine the function rule. Students make a scatter plot of...
Curated OER
Graphs Involving Absolute Value
In this Algebra I/Algebra II worksheet, learners graph absolute value functions. The two page worksheet contains four multiple choice questions. Answers are included.
Curated OER
Price of Apples- Linear Data
Students collect data and create a graph. In this algebra lesson, students describe functions graphically, algebraically and verbally. They identify functions as being independent and dependent using variables.
Curated OER
Numerical Analysis: Solving Systems Of Non-Linear Equations
In this numerical analysis learning exercise, students solve systems of non-linear equations. Examples and explanation are provided. This two-page learning exercise contains approximately three problems.
Curated OER
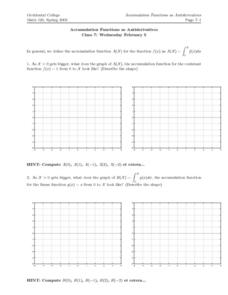
Accumulation Functions as Antiderivatives
For this accumulation functions worksheet, students describe the graph of an accumulation function for a constant function. Students describe the link between the slope of the graph of the accumulation function and the value of the...
Curated OER
Using a Graph to Solve a System of Linear Equations
In this Algebra I/Algebra II worksheet, students use graphing to solve a system of linear equations. The one page worksheet contains one multiple choice question. Answer is included.
Charleston School District
Increasing, Decreasing, Max, and Min
Roller coaster cars traveling along a graph create quite a story! The lesson analyzes both linear and non-linear graphs. Learners determine the intervals that a graph is increasing and/or decreasing and to locate maximum and/or minimum...
West Contra Costa Unified School District
Average Rate of Change
The concept of slope gets an approachable, yet theoretical, treatment in a comprehensive algebra lesson. The use of functional notation and problem-solving techniques keep the material rigorous, but detailed teaching notes and lots of...
Georgetown University
Cup-Activity: Writing Equations From Data
Determine how cup stacking relates to linear equations. Pupils stack cups and record the heights. Using the data collected, learners develop a linear equation that models the height. The scholars then interpret the slope and the...
Chapman University
Fundamental Theorems of Mathematics
There are four fundamental theorems of mathematics: arithmetic, algebra, calculus, and linear algebra listed here. Each one is described on this poster or handout. The challenge for a student of math is to figure out why they are true.
Virginia Department of Education
Logarithmic Modeling
Explore logarithms and logarithmic regression. Young mathematicians first learn about inverse functions and about the logarithm function family. They take their newfound knowledge to use logarithmic functions to model situations and...
EngageNY
End-of-Module Assessment Task - Algebra 1 (Module 4)
Critical thinking is an important aspect of mathematics — it's time to put your brain to work! Use this assessment to challenge pupils and test their skills. Concepts assessed include function notation, factoring, completing the square,...
Curated OER
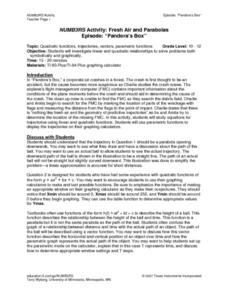
NUMB3RS Activity: Fresh Air and Parabolas
Explore parabolas and investigate linear and quadratic functions to solve problems symbolically and graphically. Also use parametric functions to display trajectories on a graphing calculator.
West Contra Costa Unified School District
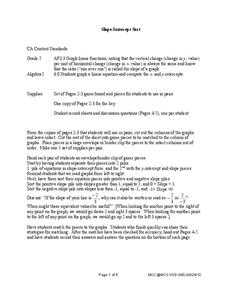
Slope-Intercept Sort
What's so special about slope? Pupils first match cards with slope and y-intercept to graphs of linear equations. They continue the lesson by matching equations in slope-intercept form to the same graphs.
EngageNY
Modeling Relationships with a Line
What linear equation will fit this data, and how close is it? Through discussion and partner work, young mathematicians learn the procedure to determine a regression line in order to make predictions from the data.
Mathematics Assessment Project
Best Buy Tickets
Everyone wants the best price when shopping — no matter what they are trying to buy. Given pricing information, pupils must solve a system of equations to determine the best option for printing tickets.
Charleston School District
Analyzing Scatter Plots
Scatter plots tell a story about the data — you just need to be able to read it! Building from the previous lesson in the series where learners created scatter plots, they now learn how to find associations in those scatter plots. They...
Concord Consortium
Look but Do Not Touch
We seem to keep missing each other. A short task provides pupils with a quadratic function, as well as a linear function with a missing coefficient. They must determine the value of the coefficient for which the graphs do not intersect.
Curated OER
Graphing Practice
Click on the download box to access this useful graphing lesson that includes worksheets for homework, assessment, and classroom work. The class graphs basic linear functions. They rewrite the equations from standard form into...
Stats Monkey
Everything I Ever Needed to Learn about AP Statistics I Learned from a Bag of M and M's®
Candy is always a good motivator! Use this collection of M&M's® experiments to introduce statistics topics, including mean, standard deviation, nonlinear transformation, and many more. The use of a hands-on model with these AP...
California Mathematics Project
Meteorology
See how estimation is essential to making temperature weather maps. Scholars use ratios and rates of change to estimate temperatures at locations where temperature readings have not been made. They connect this idea to linear functions.
Los Angeles County Office of Education
California State Standards: Algebra I
Starting a year of Algebra I? This mighty packet practices all of the major topics with different ranges of difficulty. Standards include everything from linear to quadratic to rational expressions. Use it in a variety of ways to...
Del Mar College
Intermediate Algebra Assessment Review
Put on your Algebra cap because this review provides practice on topics such as linear equations, rational expressions, and function problems. All the questions are multiple choice, and while the focus is on a few main sections, there is...
Curated OER
Linear-Quadratic Inequalities
Students graph linear and quadratic functions. In this algebra lesson plan, students create graph with specific coordinate points. They use the Ti to visualise and differentiate between the two functions.
Other popular searches
- Graphing Linear Functions
- Linear Functions and Graphs
- Writing Linear Functions
- Nonlinear Functions
- Inverse Linear Functions
- Graphs of Linear Functions
- Nonlinear Equations
- Linear Functions Activity
- Linear Functions Math Models
- Linear Functions to Graph
- Linear Functions and Models
- Power Point Linear Functions


