Benjamin Franklin High School
Saxon Math: Algebra 2 (Section 4)
This fourth of twelve units in a series continues the investigation of functions through equations and inequalities. However, the modular nature of the lessons in the section make this an excellent resource for any curriculum covering...
Curated OER
Patterns and Algebra - Modeling
Seventh grade math is so much fun! They solve 10 different problems that include using patterns to complete a table, describe the pattern, and identify the specific term in the pattern for each. Then they give a description of the...
Natinal Math + Science Initative
Slope Investigation
Context is the key to understanding slope. A real-world application of slope uses a weight loss scenario with a constant rate of change to introduce the concept of slope of a line, before it makes a connection to the ordered pairs and...
Concord Consortium
Graphical Depictions
Parent functions and their combinations create unique graphical designs. Learners explore these relationships with a progressive approach. Beginning with linear equations and inequalities and progressing to more complex functions,...
Flipped Math
Unit 5 Review: Systems of Equations
Activate transformers along with algebra systems. Pupils use 10 problems to review transformations of functions to solve a variety of systems of equations. Individuals identify the types of transformations from an equation along with...
Curated OER
Chairs Around the Table
Youngsters become flexible problem solvers with this challenging lesson. If there are 24 square tables in a restaurant, how many customers can be seated at one time? They can use manipulatives or draw pictures to help them find the...
Benjamin Franklin High School
Saxon Math: Algebra 2 (Section 1)
This first of twelve algebra 2 resources provides a broad review of many algebra 1 concepts through a number of separable lessons and labs. Starting with the real number system and its subsystems, the sections quickly but thoroughly move...
Virginia Department of Education
Line of Best Fit
Pupils work through a guided activity on fitting a linear equation to a set of data by entering the data into a calculator and trying to envision a line of best fit. They then have the calculator determine the least-squares line and...
Flipped Math
Correlation
Determine how close the line is to the scatter plot. Clear video instruction shows how to plot a scatter plot and find the best fit line using the linear regression function on a calculator. Pupils use the information from the calculator...
Radford University
Real World Data
Make math class feel more real by using real-world data. Scholars research or collect data on several different topics, such as nutrition, the motion of moving objects, cooling curves, and daylight hours. They create scatter plots using...
Flipped Math
Calculus AB/BC - Connecting Multiple Representations of Limits
It's time to put it all together. Viewers of an informative video learn to connect multiple representations of limits. Given algebraic, tabular, and graphical representations of a linear piecewise function, they determine whether a limit...
Del Mar College
Algebra Assessment Review
Jam packed with problems, this advanced Algebra worksheet focuses on topics such as domain, solving quadratics, solving rationals, and function notation.
Balanced Assessment
Transformation II
Develop a solid understanding of the manipulation of expressions to produce equivalent expressions. Given an expression, pupils rearrange it to create a new one. Their new functions must match the structure of the model expressions.
National Research Center for Career and Technical Education
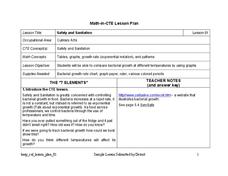
Safety and Sanitation
Your microbiologists explore the graphing of exponential growth functions using bacteria, like e. coli and salmonella, in a well-written, career and technology lesson.
GeoGebra
Too Big, or Not Too Big
Determine whether the point is just right. The interactive allows participants to input a constraint equation. Pupils pick a point and determine whether it is too big, not too big, or just right for the constraint. Using the graphing...
Radford University
Pizza, Pizza!
Ponder the problem of pizza prices. Pupils use provided information about two different pricing schedules for pizza. They create tables of values and functions to represent the pricing schemes, consider domain restrictions, and identify...
Curated OER
Other Equations of Lines
In this algebra worksheet, students find equations for 4 lines when given their slope and one point on the line. They write two linear equations when given two points on a line. Students analyze the equations of 3 sets of linear...
Curated OER
Make a Math Mascot
Create a math mascot by identifying irrational and rational numbers. Learners will also solve linear equations.
Curated OER
Linear Systems: The Determinant
In this determinant instructional activity, students explore the determinant of a matrix. After examining the given examples and explanations, they find the determinants of given matrices. This two-page instructional activity contains...
Del Mar College
Quick Reference Card
A neat and organized formula handout makes the circle go round, doesn't it? Full of higher algebra topics, formulas and rules, graphs and definitions—there is a way to support everyone in Algebra II or Pre-Calculus.
Curated OER
Sondheim: Secret Metaphors
Students explore the work of Stephen Sondheim. In this musical theater lesson, students examine the musicals Merrily We Roll Along and Sunday in the Park with George. Students identify and anaylze linear and nonlinear structural patterns...
Curated OER
Reductions of Order
In this calculus worksheet, students identify functions as linear or nonlinear, homogeneous versus nonhomogeneous by using the reduction power theorem. There are 5 questions.
Curated OER
What's My Pattern?
Students recognize, describe and extend patterns in three activities. They organize data, find patterns and describe the rule for the pattern as well as use the graphing calculator to graph the data to make and test predictions. In the...
Curated OER
Every Graph Tells A Story
Seventh graders explore linear equations. In this graphing lesson plan, 7th graders explore constant rates of change. Students discover the real-life application of graphs and demonstrate their ability to read graphs and write...
Other popular searches
- Graphing Linear Functions
- Linear Functions and Graphs
- Writing Linear Functions
- Nonlinear Functions
- Inverse Linear Functions
- Graphs of Linear Functions
- Nonlinear Equations
- Linear Functions Activity
- Linear Functions Math Models
- Linear Functions to Graph
- Linear Functions and Models
- Power Point Linear Functions


