Curated OER
Functions and the Vertical Line Test
Students explore the concept of functions. In this function lesson, students determine if the graph is a function by using the vertical line test. Students use an applet to explore the vertical line test on a variety of graphs.
Curated OER
Graphing Linear Equations
Students graph linear equations. In this algebra lesson, students perform transformation on linear equations. They identify the slope and y-intercept of each line.
Curated OER
Graphing Linear Equations
Students graph linear equations. In this algebra lesson, students solve linear equations and graph it on a coordinate plane. They evaluate integers using linear equations.
Curated OER
Polynomial Functions
Students explore polynomial functions. In this Algebra II lesson, students explore graphs of polynomial functions as classify the functions as linear, quadratic, cubic, or quartic. Students determine the regression equation for each...
Curated OER
Linear and Exponential Growth
Students explore the concept of linear and exponential growth. In this linear and exponential growth lesson, students collect data about China's population. Students model the data to determine if it is linear or exponential.
Curated OER
Composite Functions
Young scholars create a poster to explain composite functions. For this composite function worksheet, students explore linear equations and functions. They complete a worksheet and use manipulatives to complete problems.
Curated OER
Algebra II Review: Exponential Functions and Logarithms
In this Algebra II review: exponential functions and logarithms worksheet, students solve 19 problems, including making graphs, simplifying and evaluating.
Curated OER
Equations from Unit Rates
Your class can become linear equations masters, as they calculate the rate of change of a function. They observe different types of coordinates as they relate to a graph, then use the Ti-navigator to move the line around and draw...
Curated OER
Inequalities 7.3
Graph inequalities and discuss the difference in their slopes. Learners observe rate of change as they compare linear, quadratic, and cubic functions.
Curated OER
Off to College
High schoolers investigate linear, quadratic and exponential equations using the TI calculator. They identify relation and functions using ordered pairs, graph the data, analyze the data, and relate it to real-world situations.
Curated OER
Condensation Polymerization: Preparation of Two Types of Polyesters
College-level or AP chemists use phthalic anhydride to synthesize two different polyesters, one linear and one cross-linked in structure. A detailed materials list and well-written procedures are provided on a lab sheet. Learners write...
Concord Consortium
Graphical Depictions
Parent functions and their combinations create unique graphical designs. Learners explore these relationships with a progressive approach. Beginning with linear equations and inequalities and progressing to more complex functions,...
Code.org
Processing Arrays
Scholars use a playing card activity to help them develop a program to find the minimum value of a list. They learn to use for loops to write code that will process lists.
Benjamin Franklin High School
Saxon Math: Algebra 2 (Section 1)
This first of twelve algebra 2 resources provides a broad review of many algebra 1 concepts through a number of separable lessons and labs. Starting with the real number system and its subsystems, the sections quickly but thoroughly move...
Mathematics Vision Project
Module 1: Getting Ready Module
This fabulous resource is a must-have for any algebra teacher's arsenal of lessons. Developing the idea of equations and use of variables from basic physical scenarios, learners gain valuable intuition in the structure and meaning of...
Curated OER
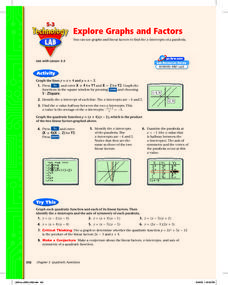
Explore Graphs and Factors
Pupils graph the factors of a quadratic as linear equations and graph the parabolic equation in factored form. Also, they investigate the relationship between the x-intercepts of the lines and the zeros of the parabola.
Curated OER
Walk the Line
Learners create constant speed versus motion graphs. They will perform linear regressions on their data to describe the graphs mathematically.
Curated OER
Let's Gather Around the Circle
Scholars explore the relationship between circumference and diameter. Groups of learners measure the diameter and circumference of round objects and record their data on a given worksheet. They then input the data into their graphing...
Curated OER
Algebra Nomograph
Investigation of a nomograph teaches young scholars to determine the rule of a function by examining the input and output values. Students use a nomograph on their Ti-Nspire to determine the function rule. Young scholars make a scatter...
Curated OER
That's a Fine Line You're Walking!
Students experiment with Hiker program to practice real world applications of linear functions and develop their understanding of expressions, relationships, and manipulations involved in writing and graphing linear equations in...
Curated OER
US Population 1790-1860
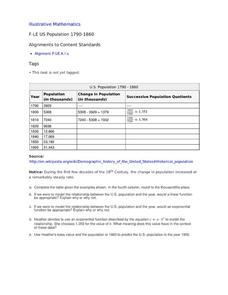
Your young population scientists analyze a table of values, write a model to represent the real life data, finish the table of data and predict future populations in a collaborative, real-life activity.
Curated OER
When the Snow is as High as an Elephant
High schoolers study the concept of mean values using a data plot. Learners enter the given data in the activity to create their data table. They use the data table to calculate the mean of the snowfall percentage provided in the...
Curated OER
Border Patrol
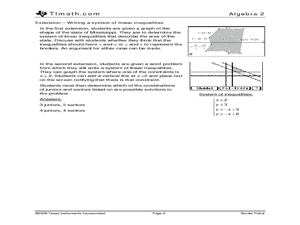
Young scholars investigate systems of linear inequalities as they apply to an area of land. They practice graphing systems and determine if a point lies in the solution.
Texas Instruments
Let's Play Ball with Families of Graphs
Learners explore quadratic equations in this Algebra II lesson plan. They investigate families of quadratic functions by graphing the parent function and family members on the same graph. Additionally, they write the equation of the...


