Texas Instruments
Making Predictions Using Systems of Equations
Students explore the concept of systems of equations. In this system of equations instructional activity, students enter data into lists on their calculators about 100 meter dash times. Students plot the points using a scatter plot and...
Curated OER
Investigating Equations of Lines
High schoolers investigate linear equations as they use technology (Cabri, Jr.) to explore the equations of lines in slope-intercept form. The technology allows learners to manipulate the line and observe the changes in the parameters of...
Curated OER
Linear-Quadratic Inequalities
Students graph linear and quadratic functions. In this algebra lesson plan, students create graph with specific coordinate points. They use the Ti to visualise and differentiate between the two functions.
Curated OER
Linear Approximation
Pupils practice examining the tangent to a function to estimate the value of the function near the point of tangency. They view errors associated with those approximations, determine overestimates and find intervals that guarantee a...
Curated OER
Beginning the Year with Local Linearity
Students investigate an article on local linearity. In this calculus instructional activity, students read about the application of math in the real world. They gain insight from the teachers view of how to teach and relate the topic to...
Curated OER
Linear Equations and Functions - Area and Perimeter
Pupils use information they know to decorate a room at a reasonable cost by comparing the cost of companies for a decorating job. In this cost lesson plan, students take into consideration the area and perimeter of the room.
Curated OER
Which Method Will You Choose? Finding Solutions to Systems of Equations.
Ninth graders investigate systems of linear equations. In this Algebra I lesson plan, 9th graders determine which method is the best for solving a systems: graphing, substitution, or elimination. Students choose a method and create a...
Curated OER
Price of Apples- Linear Data
Students collect data and create a graph. In this algebra lesson, students describe functions graphically, algebraically and verbally. They identify functions as being independent and dependent using variables.
Curated OER
Graphing Linear Equations
Eighth graders examine linear equations by creating graphs from them. In this graphing lesson, 8th graders read several linear equations and plot them on a graph with the help of their classmates. Students find the slope of the linear...
Texas Instruments
Exploring Basic Equations
Learners explore equations with constants, variables and with exponents. They identify and define variables, constants, exponents, expressions, and equations, as well as give an example of each. Your class will also draw their...
National Security Agency
Systems of Equations and Inequalities
High school classes can use manipulatives too! Offer hands-on, interactive lessons that venture away from the typical day in your algebra class. Young mathematicians will be involved in collaborative learning, visual representations, and...
CCSS Math Activities
Smarter Balanced Sample Items: 8th Grade Math – Claim 4
A math model is a good model. A slide show presents 10 sample items on modeling and data analysis. Items from Smarter Balanced illustrate different ways that Claim 4 may be assessed on the 8th grade math assessment. The presentation is...
101 Questions
What Micheal’s Coupon Should You Use?
Get your classes on their way to extreme couponing! Young mathematicians analyze two different coupon options for the better deal. They use different scenarios to predict and compare the outcomes.
Shodor Education Foundation
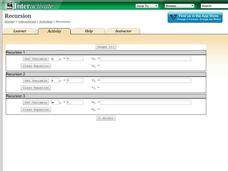
Recursion
Perform the operation ... and then do it again. Scholars investigate recursive formulas by creating and graphing them. Using the interactive, pupils set the variable, determine the initial value, and type in a recursive formula.The...
Mathematics Vision Project
Quadratic Equations
Through a variety of physical and theoretical situations, learners are led through the development of some of the deepest concepts in high school mathematics. Complex numbers, the fundamental theorem of algebra and rational exponents...
Curated OER
Graphing Real World Situations
Students solve linear equations using graphs. In this algebra lesson, students depict real life situation using lines and functions. They identify the slope, data and predict graphing behavior.
Curated OER
Investigating Linear Equations Using Graphing Calculator
Learners investigate linear equations using the Ti-Calculator. In this algebra lesson, students graph lines and identify the different quadrants on a coordinate plane. They identify ordered pairs used to plot lines.
Curated OER
Investigating Transformations Of Parent Functions
Students identify the basic transformations of parent functions. They use their graphing calculator to create a transformation booklet by folding a sheet of computer paper in half and stapling along the folded edge.
Curated OER
Count the Differences
Learners determine the degree of polynomials. In this determining the degree of polynomials lesson, students find the difference between consecutive y-values. Learners find the degree of a linear, quadratic, and cubic function by this...
Curated OER
Difference of Equations
In this difference of equations worksheet, students solve and complete 49 various types of problems. First, they obtain the solution of any linear homogeneous second order difference equation. Then, students apply the method of solution...
Curated OER
Analyzing Data Sets
In this analyzing data sets worksheet, 11th graders solve and complete 35 various types of problems that include the analysis of data given. First, they determine the equation that best describes the data shown in a table. Then, students...
Curated OER
Residential Power System
Perform data analysis on energy consumption to apply algebraic expressions to the real world. Learners will write and solve equations that answer various questions from residential power use. They will collect data at home and calculate...
PBL Pathways
Doctors and Nurses
How many nurses does it take to support one doctor? A project-based activity asks learners to analyze state data to answer this question. Classes create polynomial functions from the data of doctors and nurses over a seven-year period....
Concord Consortium
Transformations-Diagnostic
Change the way you teach about rewriting expressions. A diagnostic task asks learners to transform expressions in different ways. Given two linear expressions and two quadratic expressions, they rewrite them into the indicated forms.


