NASA
Lights on the International Space Station
Groups explore illumination with NASA's Lighting Environment Test Facility (LETF) as a context. Using the TI-Nspire app, groups determine the lux equation that models their simulation. They then use the lux equation to solve problems...
National Council of Teachers of Mathematics
National Debt and Wars
Take a functional approach to the national debt. Learners collect information about the national debt by decade and plot the data. They determine whether an exponential curve is a good fit for the data by comparing the percent changes...
Flipped Math
Exponential Growth
They grow by leaps and bounds. Learners watch a quick review on function notation as they prepare to learn more about exponential growth. Using their knowledge from sequences, pupils find out whether a function is linear or exponential,...
Radford University
Business Ownership
Let's learn a little bit about business! Given information about a t-shirt company, young mathematicians explore the revenue, costs, profits, and future sales. They develop mathematical models for these quantities using linear,...
Concord Consortium
Bill the Ball Bearing Man
Just how durable could a hollow ball bearing be? Learners model the strength of the walls of a ball bearing as a function of the radius of its cavity. They use their models to make reasonable conclusions about the probability of failure...
Curated OER
Modeling Population Growth
Students create linear, exponential, and quadratic models of U.S. population data to determine which function best represents U.S. population growth. They predict future populations based on each model.
PBL Pathways
Medical Insurance 2
Make an informed decision when choosing a medical insurance provider. An engaging lesson asks your classes to write piecewise models to represent the cost of different medical plans. The project-based learning activity is a variation of...
Curated OER
Linear Functions: Are You Ready for the REAL World?
students emulate a real world problem and model it with mathematics working in a small group. Observe and facilitate discussion as the groups use various strategies, such as (graphs, brainstorming, tables, and dialogue.
Curated OER
Polynomial Functions
Students explore polynomial functions. In this Algebra II lesson, students explore graphs of polynomial functions as classify the functions as linear, quadratic, cubic, or quartic. Students determine the regression equation for each...
Curated OER
Linear and Exponential Growth
Young scholars explore the concept of linear and exponential growth. In this linear and exponential growth instructional activity, students collect data about China's population. Young scholars model the data to determine if it is...
Curated OER
Quadratic Equations and Functions
This comprehensive lesson plan reviews solving and graphing quadratic functions and functions of higher degree. Using the vertex form of a quadratic functions, one finds the vertex, minimum or maximum, and axis of symmetry. A few word...
Curated OER
Off to College
High schoolers investigate linear, quadratic and exponential equations using the TI calculator. They identify relation and functions using ordered pairs, graph the data, analyze the data, and relate it to real-world situations.
Curated OER
Is there Treasure in Trash?
More people, more garbage! Young environmentalists graph population growth against the amount of garbage generated per year and find a linear model that best fits the data. This is an older resource that could benefit from more recent...
Mathalicious
Out of Left Field
A baseball trajectory and a parabola seem to make the best pair in real-world quadratic applications. Here is a current baseball resource with questions, discussions, and explorations regarding a quadratic function and home run...
Curated OER
US Population 1982-1988
Your algebra learners make predictions using the concepts of a linear model from real-life data given in table form. Learners analyze and discuss solutions without having to write a linear equation.
Inside Mathematics
House Prices
Mortgages, payments, and wages correlate with each other. The short assessment presents scatter plots for young mathematicians to interpret. Class members interpret the scatter plots of price versus payment and wage versus payment for...
Curated OER
Sandia Aerial Tram
Your learners analyze a table of real-life data in order to write an equation that best models the information. Exponential, quadratic, and linear rates of changes are all possibilities in this task.
Inside Mathematics
Printing Tickets
Determine the better deal. Pupils write the equation for the cost of printing tickets from different printers. They compare the costs graphically and algebraicaly to determine which printer has the best deal based upon the quantity of...
EngageNY
Analyzing Residuals (Part 2)
Learn about patterns in residual plots with an informative math lesson. Two examples make connections between the appearance of a residual plot and whether a linear model is the best model apparent. The problem set and exit ticket...
PBL Pathways
Boogie Boards
Solve a complex business puzzle by building a linear programming model. An engaging project-based learning problem has classes examining transportation costs and manufacturing limitations from several plants. Ultimately, they use their...
National Research Center for Career and Technical Education
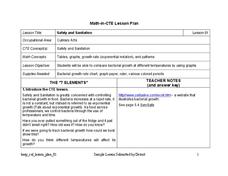
Safety and Sanitation
Your microbiologists explore the graphing of exponential growth functions using bacteria, like e. coli and salmonella, in a well-written, career and technology lesson.
Curated OER
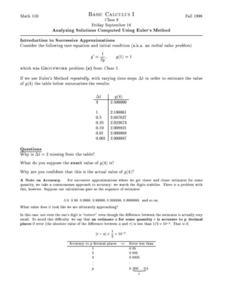
Analyzing Solutions Computed Using Euler's Method
In this analyzing solutions worksheet, students use Euler's Method to estimate the value of given functions. They estimate solutions using the piecewise-linear function model and sketch the information onto a graph. This two-page...
Curated OER
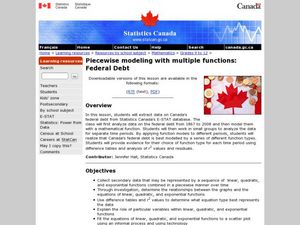
Piecewise Modeling with Multiple Functions: Federal Debt
Students analyze data on debt and write an equation. In this statistics lesson, students are given data from different time periods, and are asked to graph and analyze the data. They work in groups, and are assigned different parts of...
Curated OER
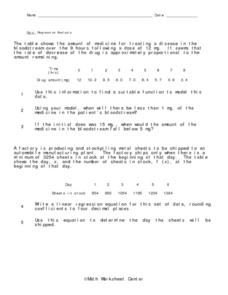
Regression Analysis
For this regression analysis worksheet, 9th graders solve 10 different word problems related to regression analysis. First, they use the information given to find a suitable function to model the data. Then, students use the model to...


