Curated OER
Getting Started with the TI-Navigator™ System: What's My Line?
Learners analyze linear functions in this algebra instructional activity. They explore the meaning of slope and the slope-intercept form of a line as they investigate the effect changing parameters on the graph of a linear function.
Curated OER
Linear Modelling of the Life Expectancy of Canadians
Middle and high schoolers explore the concept of linear modelling. In this linear modelling instructional activity, pupils find the line of best fit for life expectancy data of Canadians. They compare life expectancies of men and women,...
Curated OER
Building Understanding of Rate of Change/Slopes Using Alice
Students explore slope as a rate of change. In this eighth grade mathematics lesson plan, students investigate real-world problems to determine rate of change and transform it into a linear representation, thus determining slope....
Curated OER
Twenty-Seven Graphing Lines, Parabolas, and Absolute Value Problems
Have learners find coordinates of point on a graph, find equations of graphs given, and graph given equations using in and out tables. There are 27 problems related to equations for lines, parabolas, and absolute value functions.
Curated OER
Introducing y = mx + b
Middle and high schoolers use the slope intercept form to graph a line. In this algebra lesson, pupils rewrite equations from standard form to y-intercept form. They use the slope and y-intercept to graph a line without making a table of...
Curated OER
Activity 11: Family of Functions
Students investigate linear, quadratic, and absolute value functions. In this Algebra II lesson, students observe and describe family traits that exist among functions as they use technology to graph several functions on the same...
Curated OER
Linear Functions, Restricted Domains, Infinite Geometric Series, Interconnections
In this math worksheet, students graph the linear functions in comparison to the inequalities. Then they compare the line segments on the coordinate plane.
Curated OER
Piecewise Modeling with Multiple Functions: Federal Debt
Students analyze data on debt and write an equation. In this statistics lesson, students are given data from different time periods, and are asked to graph and analyze the data. They work in groups, and are assigned different parts of...
Inside Mathematics
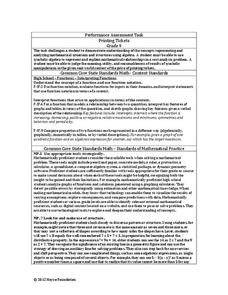
Printing Tickets
Determine the better deal. Pupils write the equation for the cost of printing tickets from different printers. They compare the costs graphically and algebraicaly to determine which printer has the best deal based upon the quantity of...
EngageNY
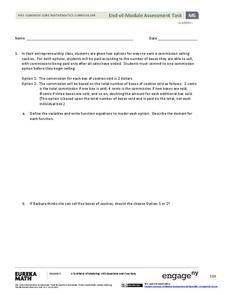
End-of-Module Assessment Task: Grade 8 Module 5
Give your class a chance to show how much they've learned in the module with an end-of-module assessment task that covers all topics from the module including linear and non-linear functions and volumes of cones, cylinders, and spheres.
Curated OER
Systems of Equations and Inequalities
This is a comprehensive lesson on creating and solving equations and systems of equations and inequalities. Problems range from basic linear equations to more complex systems of equations and inequalities based on a real-world examples....
CCSS Math Activities
Smarter Balanced Sample Items: 8th Grade Math – Target F
Functions model relationships between quantities. The Smarter Balanced sample items demonstrate the assessment strategies for eighth grade function modeling standards. Items range from constructing linear functions from a table and a...
EngageNY
Modeling a Context from Data (part 1)
While creating models from data, pupils make decisions about precision. Exercises are provided that require linear, quadratic, or exponential models based upon the desired precision.
West Contra Costa Unified School District
Writing Exponential Functions Based on Data
Give your class a concrete example of exponential growth and decay using this hands-on activity. These Algebra II lessons allow for the exploration of exponential growth and decay models, as well as the discovery of the patterns of each....
Balanced Assessment
Getting Closer
Flip the script! Reverse the situation and ask the class to find the function given asymptotes. The task requires class members to use their knowledge of functions and asymptotes to create functions that have a given asymptote or...
EngageNY
Constant Rate
Two-variable equations can express a constant rate situation. The lesson presents several constant rate problems. Pupils use the stated constant rate to create a linear equation, find values in a table, and graph the points. The resource...
EngageNY
Analyzing a Data Set
Through discussions and journaling, classmates determine methods to associate types of functions with data presented in a table. Small groups then work with examples and exercises to refine their methods and find functions that work to...
Curated OER
Practice: Word Problems
Congratulations, you've just hit the word problem jackpot! Covering an incredible range of topics from integers and fractions, to percents, geometry, and much more, this collection of worksheets will keep young mathematicians busy...
EngageNY
End-of-Module Assessment Task - Algebra 1 (Module 5)
This unit assessment covers the modeling process with linear, quadratic, exponential, and absolute value functions. The modeling is represented as verbal descriptions, tables, graphs, and algebraic expressions.
EngageNY
Modeling a Context from a Verbal Description (part 2)
I got a different answer, are they both correct? While working through modeling problems interpreting graphs, the question of precision is brought into the discussion. Problems are presented in which a precise answer is needed and others...
101 Questions
Deodorant
Smells like learning! Young scholars collect data on the length of time a stick of deodorant lasts. After modeling the data with a graph and function, they make predictions about deodorant use over time.
Curated OER
Systems of Equations
Texas Instruments and Glencoe/McGraw-Hill have put together a full lesson to help you instruct your math class. Using the textbook, a TI-83 calculator, and attached the PDF learners will solve systems of equations and state decimal...
EngageNY
Lines That Pass Through Regions
Good things happen when algebra and geometry get together! Continue the exploration of coordinate geometry in the third lesson in the series. Pupils explore linear equations and describe the points of intersection with a given polygon as...
Education Development Center
Points, Slopes, and Lines
Before graphing and finding distances, learners investigate the coordinate plane and look at patterns related to plotted points. Points are plotted and the goal is to look at the horizontal and vertical distances between coordinates and...


