Kenan Fellows
Half-Life
Scholars shake their way to understanding half-life with the help of candy. They observe and record which side candy lands on to graph the exponential decay in the fifth lesson of seven integrating chemistry and algebra. Combining...
Curated OER
Transformations in the Coordinate Plane
Your learners connect the new concepts of transformations in the coordinate plane to their previous knowledge using the solid vocabulary development in this unit. Like a foreign language, mathematics has its own set of vocabulary terms...
CK-12 Foundation
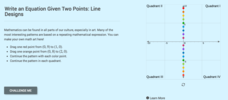
Graphs of Linear Functions: Line Designs
Designs from lines are sublime. Scholars create colorful designs by connecting points on an interactive coordinate plane. They answer questions about slope and quadrants based on their designs.
Curated OER
Graphing Linear Functions Using Their Slopes
In this Algebra I learning exercise, 9th graders graph a linear function using its slope. The one page learning exercise contains one multiple choice problem with the solution.
Curated OER
Absolute Value of Linear Functions
Students identify and interpret how absolute value affects linear functions. They also graph linear functions and reflect them in a line of symmetry. Finally, students evaluate the absolute value of a constant using technology to...
Curated OER
Reflections of a Linear Function
Students identify and reflect functions about the X-axis, Y-axis, and origin. They derive equations for reflected functions and graph the linear functions. Finally, students identify that f(x) can be reflected about each axis and the...
Curated OER
Off to College
High schoolers investigate linear, quadratic and exponential equations using the TI calculator. They identify relation and functions using ordered pairs, graph the data, analyze the data, and relate it to real-world situations.
Curated OER
Topic 3.5 & 3.6: Linear Programming
In this linear programming worksheet, students define variables and write a system of inequalities for the given situation. They model the solution through graphing. This two-page worksheet contains six multi-step word problems.
Illustrative Mathematics
Bike Race
A graph not only tells us who won the bike race, but also what happened during the race. Use this resource to help learners understand graphs. The commentary suggests waiting until the end of the year to introduce this topic, but why...
Curated OER
Linear Inequalities in One and Two Variables: Rays and Half Planes
Define rays and half planes, including the concepts of boundary lines and prerequisite knowledge of coordinate planes. Given linear inequalities in one and two variables, your class will compare the differences. They will also graph...
Curated OER
Graphing Linear Functions
Students practice solving systems of linear equations using the substitution and elimination methods. They determine if the system has one, infinite or no solution. Students also graph the linear equations.
Inside Mathematics
House Prices
Mortgages, payments, and wages correlate with each other. The short assessment presents scatter plots for young mathematicians to interpret. Class members interpret the scatter plots of price versus payment and wage versus payment for...
Virginia Department of Education
Quadratic Curve of Best Fit
Class members create a table of the number of chords that can be drawn given the number of points on a circle. Pupils analyze the data created, find a function to fit to it, and use the function to make further predictions.
Flipped Math
Exponential Growth
They grow by leaps and bounds. Learners watch a quick review on function notation as they prepare to learn more about exponential growth. Using their knowledge from sequences, pupils find out whether a function is linear or exponential,...
Concord Consortium
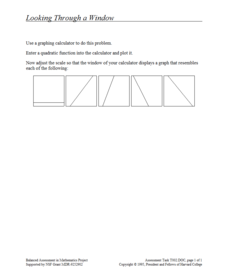
Looking through a Window
Here's a window into graphing calculators. Scholars use a graphing calculator to plot a quadratic function. They then adjust the window to make the graph look like that of a linear function and must recreate given graphs.
Curated OER
Calculus 10.2 day 2 - Vector Valued Functions
Looking for a lesson on vectors? Here is a PowerPoint that has six examples for finding velocity, acceleration, speed and direction of motion. One of the examples demonstrates the use of the TI-89 Graphing Calculator to solve a problem.
Illustrative Mathematics
Find the Change
This exercise is an opportunity for algebra learners to understand the connection between the slope of a line and points found on the line. Use similar triangles to explain why slope m is the same between any two points. Discuss with the...
GeoGebra
Too Big, or Not Too Big
Determine whether the point is just right. The interactive allows participants to input a constraint equation. Pupils pick a point and determine whether it is too big, not too big, or just right for the constraint. Using the graphing...
Illustrative Mathematics
Delivering the Mail
A mail truck travels the same amount of miles per day. It will be up to your algebra learners to find an equation for this mailman’s truck. One needs a good understanding of rate of change and the initial value for this model. The...
Illustrative Mathematics
Video Streaming
Your movie fans will be interested in this resource. They will compare video streaming plans. One plan charges a set rate per month and a reduced viewing fee, and the other has a flat rate per each video viewed. Unfortunately, students...
Virginia Department of Education
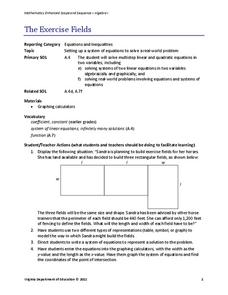
The Exercise Fields
Horses need exercise, too. Scholars create linear equations to model the perimeter of exercise fields for horses. They finish by solving their equations for the length and width of the fields.
Curated OER
Graphing Nonlinear Equations
Students graph non-linear equations. In this algebra lesson, students investigate different polynomial functions and their shapes. They identify the different powers and zeros.
Curated OER
Graphing Real World Situations
Students solve linear equations using graphs. In this algebra lesson, students depict real life situation using lines and functions. They identify the slope, data and predict graphing behavior.
PBL Pathways
College Costs 2
What is the financial benefit for attending a community college for the first two years before transferring to a four-year college? The second part of the educational lesson asks young scholars to explore this question through data...


