Discovery Education
Discovering Math: Beginning Measurement
Weight, time, length, cost, and mass are all things we can measure. Learners are introduced to the concepts they'll need to know before embarking on any measurement adventure. They are introduced to each type of measurement and types of...
Curated OER
Math and Measurement
Engage the class in exploring linear measurement and map scales. They work in groups to measure various distances in the classroom and convert measurements to other units as directed by the teacher. To access this Word document, click on...
Illustrative Mathematics
Floor Plan
A multi-step problem has learners finding the actual area based on a scale drawing and then converting units at the end. Two different solution choices are listed depending on the preference on which step to start first. Both methods can...
Curated OER
Converting Measurements
Sixth graders convert customary linear measurements. They explore using ratios to convert from inches to feet, ounces to pounds, etc. In groups, 6th graders complete conversions. They explain to the class how to solve their problems.
Curated OER
Tall Towers
Linear measurement is the focus of this math lesson. Youngsters work in groups to build towers with blocks. They build towers represented on index cards and determine how many blocks taller one tower is.
Curated OER
Measurement: Finding Areas of Rectangles
Gardening geometers construct the formula for the area of a rectangle by viewing a video revolving around two young people, their lawn mowing business, and their need to charge by the square meter. A relevant real-life application lesson!
Differentiation Central
Perimeter and Area
Leave no student behind with this differentiated geometry unit on perimeter and area. Over the course of five lessons, young mathematicians explore these foundational concepts through a series of self-selected hands-on activities and...
Curated OER
Exploring the Hudson in 1609
While this lesson focuses on a study of the Hudson River, it could be used as a template for a discussion of map skills, converting measurements, and plotting a route. The lesson includes vocabulary and other resources to make it a...
West Contra Costa Unified School District
The Power of Ten: Building a Magnitude Model
Add visual representation to teaching place value with a magnitude model. Using adding machine tape, pupils build a linear place value strip from 1 to 100.
Curated OER
Celsius to Fahrenheit
Students convert degrees between two different units. In this algebra lesson, students graph linear equations and identify the line of best fit. They use their line of best fit to make predictions given a set of data.
Bowland
Alien Invasion
Win the war of the worlds! Scholars solve a variety of problems related to an alien invasion. They determine where spaceships have landed on a coordinate map, devise a plan to avoid the aliens, observe the aliens, and break a code to...
Project Maths
Inequalities
Which number is bigger? Using a variety of activity sheets, this unit starts with the basics of inequalities and progresses through solving compound linear inequalities. Problems cover the range of inequalities including inequality word...
Curated OER
Measuring and Comparing Mass With a Balance
Fifth graders observe and demonstrate measuring and comparing mass using a balance. They discuss the definition of mass and the units of measurement used, observe how a balance is used, and with a partner balance the baskets of the...
Statistics Education Web
The United States of Obesity
Mississippi has both the highest obesity and poverty rate in the US. Does the rest of the data show a correlation between the poverty and obesity rate in a state? Learners tackle this question as they practice their skills of regression....
Curated OER
The Gum Drop
Students find the area of three figure by the traditional formulaic methods. Then they count the number of grid squares to double check. They show an intuitive sense of Pick's Algorithm by counting every two boundary squares as one unit....
Curated OER
Discovering New Mexico
Seventh graders discuss the elements of maps and using basic linear measurement. They calculate the distance between the cities and create a simulated journey around New Mexico using a road map. They write out the directions for their...
EngageNY
Conversion Between Celsius and Fahrenheit
Develop a formula based upon numerical computations. The 31st part of a 33-part unit has the class determine the formula to convert a temperature in Celsius to a temperature in Fahrenheit. They do this by making comparisons between the...
Teach Engineering
Edible Rovers (High School)
Design and build a rover ... then eat it? This activity has groups of two design and build Mars rovers. The teams determine what instruments they want to include with their rover and plan a budget. They calculate the cost of the body of...
EngageNY
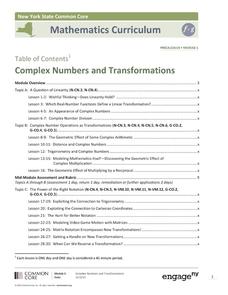
Complex Numbers and Transformations
Your learners combine their knowledge of real and imaginary numbers and matrices in an activity containing thirty lessons, two assessments (mid-module and end module), and their corresponding rubrics. Centered on complex numbers and...
Shodor Education Foundation
InteGreat
Hands-on investigation of Riemann sums becomes possible without intensive arithmetic gymnastics with this interactive lesson plan. Learners manipulate online graphing tools to develop and test theories about right, left, and...
Curated OER
Measurement
Pupils experience a positive science experiment and study fundamental concepts of measurement.
Curated OER
Math: Methods of Measurement
Fourth graders practice linear measurement skills by applying various measuring instruments to determine the heights of classmates. By measuring the heights of second graders and fourth graders, they construct tables of height and age...
Curated OER
Party Volumes: Measurement
Second graders explore liters and milliliters. They estimate volume and accurately measure the volume. Students plan a party and measure volume using liters and milliliters as part of the planning process.
American Statistical Association
EllipSeeIt: Visualizing Strength and Direction of Correlation
Seeing is believing. Given several bivariate data sets, learners make scatter plots using the online SeeIt program to visualize the correlation. To get a more complete picture of the topic, they research their own data set and perform an...


