Curated OER
High School Mathematics Problems from Alaska: Problem Setup and Pattern Recognition: Sunrise in Barrow, Alaska
Students make predictions using given data, writing a linear equation from given data, and using a linear equation to predict later behavior.
Curated OER
Perimeters, Patterns, and Conjectures
Students discover patterns and write conjectures relating to perimeters and polygons. Working in cooperative learning groups, they use manipulatives and graphic organizers to solve problems then answer a series of questions in which they...
Curated OER
Graphing and the Coordinate Plane
Students examine the four quadrants of Cartesian coordinate plane. They play maze games and coordinate games to discover how to read and plot points on the plane. Students plot points on the coordinate plane and examine the ratio of...
West Contra Costa Unified School District
Writing Exponential Functions Based on Data
Give your class a concrete example of exponential growth and decay using this hands-on activity. These Algebra II lessons allow for the exploration of exponential growth and decay models, as well as the discovery of the patterns of...
Inside Mathematics
Population
Population density, it is not all that it is plotted to be. Pupils analyze a scatter plot of population versus area for some of the states in the US. The class members respond to eight questions about the graph, specific points and...
Mathematics Vision Project
Module 1: Sequences
Sequences are all about recognizing patterns. A module of 11 lessons builds pupils' understanding of sequences through pattern analysis. The practice connects the analysis to linear and exponential equations. This is the first module in...
Education Development Center
Points, Slopes, and Lines
Before graphing and finding distances, learners investigate the coordinate plane and look at patterns related to plotted points. Points are plotted and the goal is to look at the horizontal and vertical distances between coordinates and...
Concord Consortium
Intersections II
How many intersections can two absolute value functions have? Young scholars consider the question and then develop a set of rules that describe the number of solutions a given system will have. Using the parent function and the standard...
Shodor Education Foundation
Sequencer
Take the first step into graphing sequences. Learners set the starting number, multiplier, add-on, and the number of steps for a sequence. Using the inputs, the interactive calculates and plots the sequence on the coordinate plane. Users...
EngageNY
Multiplying and Factoring Polynomial Expressions (part 2)
If you can multiply binomials, you can factor trinomials! This is the premise for a lesson on factoring. Pupils look for patterns in the binomials they multiply and apply them in reverse. Examples include leading coefficients of one...
Curated OER
Algebra: Linear Equations
Young scholars draw graphs of linear equations using the slope intercept form. Upon completion of various problems, students record their answers on the board and explain the solutions to classmates. Young scholars take a test over...
Virginia Department of Education
Transformationally Speaking
Young mathematicians explore transformations of graphs by graphing sets of functions on the same pair of axes. They use their graphs to determine the effect that the values of a and b in y = ax + b have on the graph of y = x.
Curated OER
Interpreting and Displaying Sets of Data
Students explore the concept of interpreting data. In this interpreting data instructional activity, students make a line plot of themselves according to the number of cubes they can hold in their hand. Students create their own data to...
Chemistry Collective
Chemical Potential: Staircase Demonstration
It's all uphill from here! Scholars examine the pattern of random particle motion up a staircase. The simulation shows how the linear increase in energy corresponds to an exponential decrease in particle concentration.
Curated OER
Interpreting Data
For this interpreting data worksheet, students solve and complete 4 different types of problems using different data types. First, they collect raw data from a paragraph shown. Then, students identify the examples of two different types...
Curated OER
Move It
Studens collect and graph data. In this algebra lesson, students use a CBL and CBR with a TI Calcualtor to observe linear graphs. They use the correct vocabualry as they discuss the collected data.
Curated OER
Know the System
Pupils identify the different systems of equations. In this algebra lesson, students solve systems of equations using graphing, elimination and substitution. They use the Ti to graph their systems.
Curated OER
I Can Do This! Systems of Equations
Students solve systems of 2-by-2 linear equations using tables,
graphs and substitution. In small groups, classmates work together to discover strategies for solving equations. They use a calculator to graphically represent their answers.
Curated OER
That's a Fine Line You're Walking!
Students experiment with Hiker program to practice real world applications of linear functions and develop their understanding of expressions, relationships, and manipulations involved in writing and graphing linear equations in...
Curated OER
Analyzing Cubes
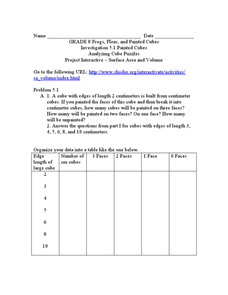
For this analyzing cubes worksheet, 9th graders solve and complete 6 different types of problems. First, they organize the given data into the table provided. Then, students study the patterns in the table and tell whether the pattern of...
Curated OER
Decode Word Is..
Students solve problems using patterns. In this algebra lesson, students identify the relation, domain and range of a function. They graph functions using coordinate pairs.
Curated OER
Means of Growth
Learners collect and graph data. In this statistics lesson, students analyze their plotted data using a scatter plot. They identify lines as having positive, negative or no correlation.
Curated OER
Walking on Air
Students collect and analyze data with a graph. In this statistics lesson, students use central tendencies to find the meaning of their data. They display the data on a Ti calculator.
Curated OER
How popular is your favorite site?
Learners gather data for the project for the entire year. They plot their data, try to fit a equation to their data, and speculate on why the data shows the pattern it does and project its future growth.


