Virginia Department of Education
Logarithmic Modeling
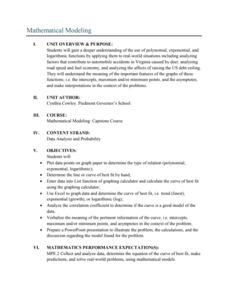
Explore logarithms and logarithmic regression. Young mathematicians first learn about inverse functions and about the logarithm function family. They take their newfound knowledge to use logarithmic functions to model situations and...
Teach Engineering
Linear Regression of BMD Scanners
Objects may be more linear than they appear. Scholars investigate the relationship between the number of bone mineral density scanners in the US and time. Once they take the natural logarithm of the number of scanners, a linear...
Radford University
Mathematical Modeling: Lesson 1
Will more deer result in more big game licenses? Scholars first research data on the number of deer and the number of big game licenses in Virginia between 1990 to 2009. They apply polynomial, exponential, and logarithmic regression to...
Radford University
Mathematical Modeling: Lessons 2-3
Not all functions are created equal. Pupils apply regression analysis using polynomial, exponential, and logarithmic functions to investigate the relationship between variables and to decide which function would be best to model the...
Curated OER
Logarithmic Transformations of Data
Students investigate and study logarithmic equations. In this precalculus instructional activity, students analyze the data behind the function. They define each graph as positive, negative or no correlation. They find the line of best fit.
Curated OER
Linear and Exponential Models
High schoolers investigate the differences between linear and exponential models. In this linear and exponential models lesson, students make a table of given data. High schoolers determine if the data is linear or...
Radford University
Earthquake Problem
Shake up things in the classroom. The unit uses earthquakes to bring a real-life connection to finding arc lengths, logarithms, and equations of circles. Small groups determine whether particular towns would have felt an earthquake after...
Radford University
Real World Data
Make math class feel more real by using real-world data. Scholars research or collect data on several different topics, such as nutrition, the motion of moving objects, cooling curves, and daylight hours. They create scatter plots using...
Achieve
Medication Dosage
Here's the cure to boredom. Given a patient file, including medication dosage information, scholars determine the amount of medication left in the patient's bloodstream over time. They analyze the sequence of numbers and determine a...
Curated OER
Linear and Exponential Models
Students linearize data to determine if an exponential model is suitable. In this linearizing data to determine if an exponential model is suitable lesson plan, students graph the residuals of sets of data that appear to have an...
Radford University
Sleep and Teen Obesity: Is there a Correlation?
Does the number of calories you eat affect the total time you sleep? Young mathematicians tackle this question by collecting their own data and making comparisons between others in the class through building scatter plots and regression...
Curated OER
Will Exams Be Cancelled?
If the flu outbreak continues, exams will have to be canceled. Investigate the properties of exponential and logarithmic functions. In this algebra lesson, students use the TI to examine and differentiate between exponential growth and...
Virginia Department of Education
Curve of Best Fit
Which function models the data best? Pupils work through several activities to model data with a variety of functions. Individuals begin by reviewing the shapes of the functions and finding functions that will fit plotted data points. By...
Teach Engineering
Light Intensity Lab
Let there be light. The last installment of a seven-part series has pupils conduct an experiment on light attenuation through different numbers of transparency sheets. They then relate the results back to how X-rays measure bone density.
Teach Engineering
Statistical Analysis of Flexible Circuits
Scholars connect statistical analysis with flexible electric circuits. They first learn about flexible circuits and their applications through a PowerPoint presentation and then consider how the fabrication process for these circuits...
Teach Engineering
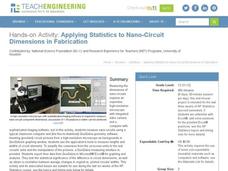
Applying Statistics to Nano-Circuit Dimensions in Fabrication
Do flexible circuits change dimensions during fabrication? Groups use GeoGebra software to measure the length of pictures of flexible nano-circuits. To determine if the circuits change dimensions, future engineers use Microsoft...
Curated OER
Leap Into Exponential Functions
Students use properties of exponents to solve equations. In this algebra lesson, students add, subtract, multiply and divide exponential functions. They graph and differentiate between exponential growth and decay.
Curated OER
Matchstick Math: Using Manipulatives to Model Linear, Quadratic, and Exponential Functions
Playing with matches (unlit, of course) becomes an engaging learning experience in this fun instructional unit. Teach pupils how to apply properties of exponential functions to solve problems. They differentiate between quadratic and...
Curated OER
Determination of An Acid Dissociation
In this chemistry worksheet, students examine the given concept in order to apply in the laboratory setting. The sheet includes in depth background information.
Curated OER
Carbon Dating
Simulate C-14 decay using M&M and Reese's Pieces candies. In this scatter-plot lesson, high schoolers perform an experiment to simulate the half life of C-14. Information is plotted on a scatter-plot. Students answer four...
Curated OER
TI-89 Activities for PreCalculus and AP Calculus
Using the TI-89 calculator, high schoolers explore the statistical, graphical and symbolic capabilities of the TI-89. Students investigate topics such as solving systems of equations, finding inverse functions, summations,...
Curated OER
Students Analyze Data With Scatter Plots
Scatter plot lessons can help students create different types of graphs by hand or with the aid of technology.
Curated OER
Precalculus: Function Models for Real-Life Situations
Students use calculators and "by hand" techniques to compare models of real-life data situations, determine the best model for a situation, and use their models to make predictions.
TeachEngineering
Teach Engineering: Linear Regression of Bmd Scanners
Students complete an exercise showing logarithmic relationships and examine how to find the linear regression of data that does not seem linear upon initial examination. They relate number of BMD scanners to time.


