Curated OER
Reading Graphs with a Logarithmic Scale
Guide high school meteorologists through a detailed examination of oxygen concentration data. The learners analyze a line graph containing logarithmic data and employ the use of a graphing calculator. A comprehensive worksheet and links...
Balanced Assessment
A Loud Noise
In a scale measuring noise, an increase in 10 dB is a 10 time increase in power. Mathematicians examine the data graph of a real world exponential growth, with no logarithmic scale, and then create two equations relating the...
EngageNY
Logarithms—How Many Digits Do You Need?
Forget your ID number? Your pupils learn to use logarithms to determine the number of digits or characters necessary to create individual ID numbers for all members of a group.
Learning Games Lab
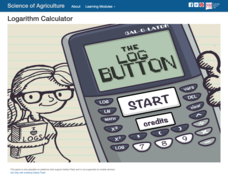
Logarithm Calculator
Support your young scientists' knowledge of logarithms with a quick video lesson. The instruction first presents the relationship between a base-10 logarithm and an exponential equation. It then demonstrates how to use a calculator to...
EngageNY
Graphs of Exponential Functions and Logarithmic Functions
Graphing by hand does have its advantages. The 19th installment of a 35-part module prompts pupils to use skills from previous lessons to graph exponential and logarithmic functions. They reflect each function type over a diagonal line...
Chemistry Collective
Virtual Lab: Determination of the pH Scale by the Method of Successive Dilutions
Where did the pH scale come from? Take a deeper look at a most important measure of ion concentration using a simulated physical determination. Young chemists prepare a series of dilutions after determining a dilution factor for the...
Teach Engineering
Common and Natural Logarithms and Solving Equations
Log some practice with logarithms. A PowerPoint presentation provides a tutorial on the change of base formula involving natural logarithms and solving exponential equations with logarithms in the fourth installment of a seven-part...
EngageNY
The Graph of the Natural Logarithm Function
If two is company and three's a crowd, then what's e? Scholars observe how changes in the base affect the graph of a logarithmic function. They then graph the natural logarithm function and learn that all logarithmic functions can be...
EngageNY
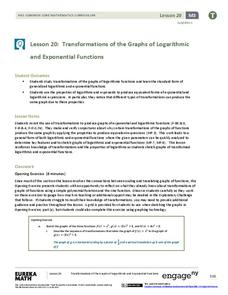
Transformations of the Graphs of Logarithmic and Exponential Functions
Transform your instructional activity on transformations. Scholars investigate transformations, with particular emphasis on translations and dilations of the graphs of logarithmic and exponential functions. As part of this investigation,...
Curated OER
Properties of Logarithms
Students explore the concept of logarithms. In this logarithms lesson plan, students discuss the logarithm properties. Students use linear functions as a basis to develop the logarithm properites by substituting log b and log...
National Nanotechnology Infrastructure Network
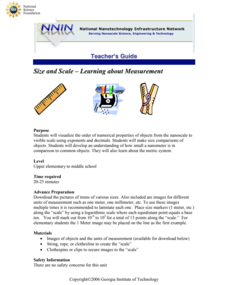
Size and Scale – Learning about Measurement
Can you visualize one billionth of a meter? It's not easy to understand the scale of a nanometer. Learners use a hands-on lesson to develop an understanding of the size of a nanometer in comparison to common objects. They walk away with...
University of Colorado
Spacecraft Speed
Space shuttles traveled around Earth at a speed of 17,500 miles per hour, way faster than trains, planes, or automobiles travel! In the 13th installment of 22, groups graph different speeds to show how quickly spacecraft move through...
Curated OER
Properties of Logarithmic Functions
Students solve exponential functions. In this algebra lesson plan, students identify the properties of logarithmic and exponential functions. They graph their functions and solve using change of base formula.
Curated OER
Magnitude of the Richter Scale
Students examine how a Richter scale operates. They create a booklet illustrating each rating on the scale. They discover how engineers use different measurement tools.
Curated OER
Exponential and Logarithmic Equations
In this Algebra II/Pre-calculus worksheet, students solve logarithmic and exponential equations in problem solving situations. The three page worksheet contains eleven problems. Answers are not provided.
Curated OER
A Model Solar System
If Earth is modeled by a grapefruit, what planet could be represented by a golf ball? This activity uses everyday and not-so-everyday objects to create a model of the Solar System.
Curated OER
Sense of Scale
Middle schoolers examine the pH scale. They research common products and determine their pH level. They create their own pH scale and place their products in the appropriate place.
Curated OER
Discovering Different Types of Functions
Graph polynomials and identify the end behavior of each polynomial function. The class differentiates between linear, quadratic, and other polynomial equations.
Teach Engineering
Statistical Analysis of Flexible Circuits
Scholars connect statistical analysis with flexible electric circuits. They first learn about flexible circuits and their applications through a PowerPoint presentation and then consider how the fabrication process for these circuits...
Teach Engineering
Applying Statistics to Nano-Circuit Dimensions in Fabrication
Do flexible circuits change dimensions during fabrication? Groups use GeoGebra software to measure the length of pictures of flexible nano-circuits. To determine if the circuits change dimensions, future engineers use Microsoft...
Curated OER
Graphing Functions
For this graphing functions worksheet, students write functions in logarithmic and exponential forms. They evaluate logarithms and determine the inverse of a function. Students graph functions. This six-page worksheet...
Chymist
Visualizing pH
Why are acids and bases important in our daily lives? Lead the class in answering this question, among others, as they experiment with pH paper and classify where various substances belong on the pH scale. They also taste common acids...
Curated OER
Sonic Booms and Logarithms
Young scholars practice working with the symbolic notation for logarithms. They understand various types of patterns and functional relationships. They use symbolic forms to represent and analyze mathematical situations.
Curated OER
What's a Tree Worth?
High schoolers calculate the board footage of a tree. In this forestry lesson plan, students use a Biltmore tree scale stick to calculate the number of board feet that would be produced. They quantify the economic value of a tree from...


