Baylor College
Pre-Assessment: Earth's Energy Sources
A ten-question, multiple-choice quiz assesses what your elementary earth scientists know about the atmosphere both before and after a unique unit on global atmospheric change. Make sure to check out the activities and lesson plans...
Texas Instruments
Finding Linear Models Part III
Explore linear functions! In this Algebra I lesson, mathematicians graph data in a scatter plot and use a graphing calculator to find a linear regression and/or a median-median line. They use the model to make predictions.
Curated OER
Piecewise Linear Functions: Extending Stories to Graphs
Using this resource, scholars develop graphs that model situations by showing change over time. They answer 15 questions based on information from charts that show growth in weight. They extend the concepts to an assessment section of...
Micron Technology Foundation
Early - Weather and Seasons
Young scientists from any region can take a scientific journey and be exposed to weather changes that include rain and snow.
Howard Hughes Medical Institute
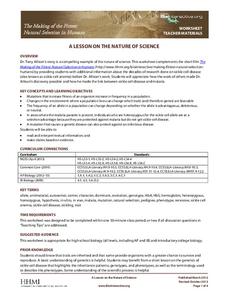
A Lesson on the Nature of Science
If you are looking for a great way to present natural selection in humans, look no further. This handout is intended to accompany the 14-minute video The Making of the Fittest: Natural Selection in Humans, which can be found on the...
Bully Free Systems
Bully Free Lesson Plans—Eighth Grade
Middle schoolers are likely very familiar with the concept of bullying and cliques. Discuss their experiences and brainstorm ways to handle peer conflict and feelings of exclusion with a poem that focuses on bullying, and a second lesson...
West Contra Costa Unified School District
Properties of Multiplication
Unlock the keys to fluent multiplication with this upper-elementary math lesson. After an introduction to the five properties of multiplication, learners match cards with different math problems to posters describing each...
EngageNY
Motion Along a Line – Search Robots Again
We can mathematically model the path of a robot. Learners use parametric equations to find the location of a robot at a given time. They compare the paths of multiple robots looking for parallel and perpendicular relationships and...
EngageNY
Constant Rates Revisited
Find the faster rate. The resource tasks the class to compare proportional relationships represented in different ways. Pupils find the slope of the proportional relationships to determine the constant rates. They then analyze the...
Curriculum Corner
Guest Teacher Plans: Kindergarten
Emergencies happen. Be prepared the next time you have to call in a substitute with a lesson plan designed to meet the needs of a kindergarten class. Throughout the day, class members work with number and alphabet cards, identify numbers...
EngageNY
Lines That Pass Through Regions
Good things happen when algebra and geometry get together! Continue the exploration of coordinate geometry in the third lesson in the series. Pupils explore linear equations and describe the points of intersection with a given polygon as...
Center for Civic Education
What Is Authority?
Young scholars examine the concepts of power and authority as they begin learning about government in this elementary social studies lesson. Through a series of readings, discussions, and problem solving activities, children...
Math Worksheets Land
Probability of Chance Events - Guided Lesson
Show learners that their choices can change based on probability. The lesson discusses the idea of theoretical and experimental probability when choosing items or flipping a coin. Use the page with the additional resources...
West Contra Costa Unified School District
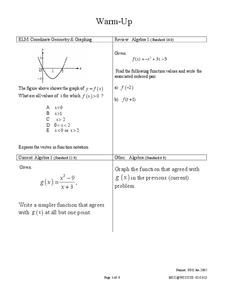
Derivative – Standard Definition
Making a clear connection to algebra concepts helps learners understand the definition of a derivative. The lesson begins with looking at limits of simple linear and rational functions, and leads to the definition of the...
Curated OER
Climate Change
In these science worksheets, 5th graders explore aspects of weather and recycling. In the first worksheet, students are given five questions about weather which they match to the statement about weather that corresponds to it. In the...
Curated OER
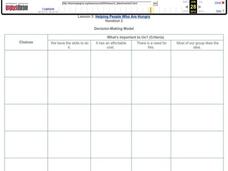
Decision-Making Model
In this decision making worksheet, students fill out the choices, skills, cost, and more when making decisions. Students fill out 25 boxes total.
Berkshire Museum
Adopt a Schoolyard Tree
Help young scientists connect with nature and learn about trees with a fun life science lesson. Heading out into the school yard, children choose a tree to adopt, taking measurements, writing descriptions, and drawing sketches of it in...
Hampton-Brown
Esperanza Rising
Accompany a reading of the novel, Esperanza Rising by Pam Muñoz Ryan, with a series of lessons that dive deep into the literary world of a young girl and the journey she takes to start a new life. Lessons and their...
Virginia Department of Education
May I Have Fries with That?
Not all pie graphs are about pies. The class conducts a survey on favorite fast food categories in a instructional activity on data representation. Pupils use the results to create a circle graph.
EngageNY
Mid-Module Assessment Task: Grade 8 Module 6
Make sure pupils have the skills to move on to the second half of the module with a mid-module assessment task. The formative assessment instrument checks student learning before moving on to the rest of the lessons in the unit.
Core Knowledge Foundation
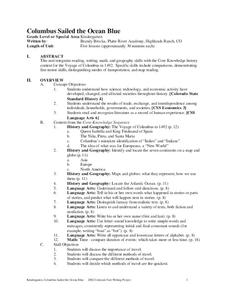
Columbus Sailed the Ocean Blue
Young adventurers embark on a journey, setting sail along the blue ocean with Christopher Columbus. Teachers will find that this unit makes their lesson planning smooth sailing!
Curated OER
Changing It Up
How should a cashier stock a cash register with coins? Learners use mathematical modeling and expected value to determine how many rolls of coins of each type they should place in a cash register.
Wordpress
Introduction to Exponential Functions
This lesson plan begins with a review of linear functions and segues nicely over its fifteen examples and problems into a deep study of exponential functions. Linear and exponential growth are compared in an investment task. Data tables...
Charleston School District
The Line of Best Fit
If it's warm, they will come! Learners find a line of best fit to show a relationship between temperature and beach visitors. Previous lessons in the series showed pupils how to create and find associations in scatter plots. Now,...


