Indian Land Tenure Foundation
A Sense of Belonging
In order to understand how the land changes over time because of the people who live there, learners interview an elderly person about the past. Children ask an older family member to describe what the local area was like when they were...
iCivics
Students, Engage!
Discuss as a class some problems that you would like to see changed in your school or community, and then take action! After your young citizens determine the appropriate steps they should take to accomplish their objectives, they will...
Curated OER
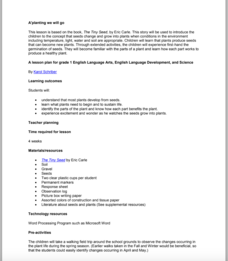
A'planting We will Go
Germination is an amazing process that results in amazing things. The book The Tiny Seed is the inspiration for a set of activities that will help build early literacy, observation, language, and writing skills. The class observes how...
Mathematics Vision Project
Module 6: Trigonometric Functions
Create trigonometric functions from circles. The first lesson of the module begins by finding coordinates along a circular path created by a Ferris Wheel. As the lessons progress, pupils graph trigonometric functions and relate them to...
Chicago Botanic Garden
Seed Dispersal and Plant Migration
There are five methods of seed dispersal. They include gravity, mechanical, animal, water, and air. Scholars study seed dispersal in lesson five of the series of six. Through discussions, hands-on analysis of different seed types, and...
Willow Tree
Line Graphs
Some data just doesn't follow a straight path. Learners use line graphs to represent data that changes over time. They use the graphs to analyze the data and make conclusions.
EngageNY
Comparing Linear Functions and Graphs
How can you compare linear functions? The seventh installment of a 12-part module teaches learners how to compare linear functions whose representations are given in different ways. They use real-world functions and interpret features in...
Serendip
Evolution of Fur Color in Mice – Mutation, Environment and Natural Selection
Most species of animals include a variety of fur or hair color, but why? Scholars watch a video about a changing environment for mice. As the rocks around them change hues, different colors of mice begin to thrive. Discussion questions...
Curated OER
Connect the Spheres: Earth Systems Interactions
Is everything really connected? Take your class on a walk outside, where they will make observations and write them down on a worksheet. Once they are back in the classroom, learners will work to determine if and how things like birds,...
National Save
Dating Violence: Are You a Victim?
The teenagers in your class are probably involved in romantic relationships, but are they keeping themselves safe? Guide learners through the warning signs for dating violence with a series of lessons and discussions.
Math Solutions
Factor Game
Learning about factors and multiples is all fun and games with this simple math activity. The instructional activity begins with the teacher and class playing the Factor Game together as students figure out the rules and uncover key...
Public Schools of North Carolina
Math Stars: A Problem-Solving Newsletter Grade 2
Develop the problem solving skills of your young learners with this collection of math newsletters. Covering a variety of topics ranging from simple arithmetic and number sense to symmetry and graphing, these worksheets offer a nice...
Center for Learning in Action
Gases
Explore the properties of gases through one activity and two investigations in which super scientists observe the changes gas makes when encountering different conditions.
Willow Tree
Bar Graphs
Circles, lines, dots, boxes: graphs come in all shapes in sizes. Scholars learn how to make a bar graph using univariate data. They also analyze data using those bar graphs.
Social Media Toolbox
Social Media Usage
Is there a difference in the way organizations present news via social media and in print? The third in a series of 16 lessons from The Social Media Toolbox explores news outlets and their delivery methods. Groups follow a story for a...
The New York Times
Collateral Damage? Researching a Connection Between Video Games and Violence
Hook your class into an exploration of and discussion about violence in video games with a cute animal clip and a video game trailer. After a quick discussion about how media can affect mood, class members read a related article and...


