Curated OER
What Would Make Our School More "Green"?
Students survey their school to get ideas for how to make the school more environmentally friendly. In this environmental lesson plan, students collect data from other students and teachers. They use the data to create graphs and present...
Southern Nevada Regional Professional Development Program
Reading Literature - The Ruin
Cross-comparison, the technique of focusing on two different texts with the same themes, motifs, events, etc., is employed in an exercise that asks groups to examine two different translations of “The Ruin,” a poem, written in Old...
Howard Hughes Medical Institute
Lesson 7: Observations Across Habitats
How are animals in separate but nearby habitats related? Ecology scholars compare the animal inhabitants of the Gorongosa National Park in part seven of an eight-part series. Learners study photos from two different habitats, then...
Curated OER
Animal Nutrition, Variations, Adaptations & Regulation
Information about digestion of various food components is given in this PowerPoint. The diets of herbivores and carnivores are compared, and there are many diagrams giving details of their digestive system specializations. The labelled...
Curated OER
Parachute Drop
Learners will have fun creating a parachute to collect data with. They will construct the parachute in small groups, measure the materials, and create an observation sheet. Then they drop the parachute and make predictions about how long...
Curated OER
Multiplying With Nine As A Factor
Elementary math minds complete various activities to memorize the multiples of nine. They watch a PowerPoint presentation and demonstrate the finger trick. Unfortunately the link to the multiplication activities does not take you...
Serendip
Structure and Function of Cells, Organs and Organ Systems
Cells of different organs have unique cell functions. Learn how cell functions vary depending on their roles in the body using an inquiry-based activity. Scholars analyze the cell structure to make comparisons to its functions, allowing...
Curated OER
German Energy Conversations
High schoolers identify and interpret the current German energy mix and trends, as well as to make comparisons and contrasts to that of their own country. They write a two paragraph description of including its likely position in the...
Pingry School
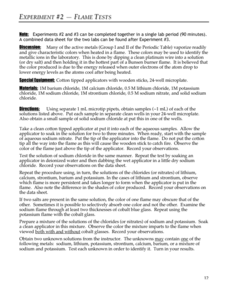
Flame Tests
Light a fire in your pupils! Scholars conduct a flame test and observe the emission spectra of several different salts in an enlightening hands-on investigation. They use their observations to make comparisons and conclusions about the...
Google
Graphing with Google Docs & Forms
Get to know your class and teach about data analysis all with the help of Google Docs. Using student-generated questions, create a class survey using Google Forms. Reserve time in the computer lab for learners to complete the form and,...
US Environmental Protection Agency
Role of Plants in Water Filtration
Investigate the amazing ability of plants to filter contaminants from water with this series of in-class demonstrations. After placing six small, potted plants in plastic cups, different solutions and mixtures are poured into them that...
EngageNY
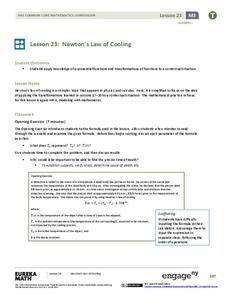
Newton’s Law of Cooling
As part of an investigation of transformations of exponential functions, class members use Newton's Law of Cooling as an exponential model to determine temperature based on varying aspects. The resource makes comparisons between models...
EngageNY
Estimating Quantities
Apply the concept of magnitude to estimate values and compare numbers. The ninth lesson of the 15-part series asks learners to write numbers to their next greatest power of 10 and then make comparisons. Scholars begin to understand the...
EngageNY
Definition of Congruence and Some Basic Properties
Build a definition of congruence from an understanding of rigid transformations. The lesson plan asks pupils to explain congruence through a series of transformations. Properties of congruence emerge as they make comparisons to these...
EngageNY
Comparing Irrational Numbers
Build on your classes' understanding of irrational numbers by comparing their values. The 13th lesson in the 25-part module has individuals estimate values of both perfect and non-perfect roots. They finish by graphing these numbers on a...
EngageNY
Problem Solving Using Rates, Unit Rates, and Conversions
Find a way to work with rates. The 23rd part in a 29-part series presents work problems for the class to solve given work rates. Pupils compare rates to determine which is faster. Some problems require learners to convert the rates to...
Curated OER
Weather and Climate
It's hot today, but is that the weather or the climate? This colorful presentation isolates both concepts to allow for better understanding by covering the positioning of the planet, making comparisons of land versus water, and looking...
Mathematics Vision Project
Features of Functions
What are some basic features of functions? By looking at functions in graphs, tables, and equations, pupils compare them and find similarities and differences in general features. They use attributes such as intervals of...
CK-12 Foundation
Single Bar Graphs: Hockey Teams
Raise the bar for hockey fans. Using data about favorite hockey teams, pupils build a bar graph. They use the information from the graph to make comparisons and solve one- and two-step problems.
CK-12 Foundation
Interpretation of Circle Graphs: Northwest Region Population Pie
Given populations of the five Northwestern states, learners create a circle graph. Using the data and the pie chart, they make comparisons between the populations of the states. Finally, the pupils determine how the chart will change...
CK-12 Foundation
Multiple Line Graphs: Jack's Jumpshot
What are the advantages to seeing multiple data sets on the same graph? Scholars explore this question as they manipulate the animation within the lesson. Questions within the interactive ask individuals to make comparisons across the...
Shodor Education Foundation
Scatter Plot
What is the relationship between two variables? Groups work together to gather data on arm spans and height. Using the interactive, learners plot the bivariate data, labeling the axes and the graph. The resource allows scholars to create...
College Board
2004 AP® Statistics Free-Response Questions Form B
Over the years, data analysis has been important. Looking back to the 2004 AP® Statistics Form B free-response questions, pupils and teachers see the importance of analysis of data sets. The six questions contain analysis of data on...
Alabama Wildlife Federation
Leaf Chromatography
Pigmentation of leaves is important in plant processes. Scholars use chromatography to create a better picture of the pigmentation in an assortment of leaves. They share their results to make comparisons between different plant species.


