Curated OER
Application of Linear Systems
Let the learners take the driving wheel! The class solves systems of linear equations and applies the concepts of systems to solve a real-world situation about parking cars and buses. They then use calculators to create a visual of their...
Curated OER
MAP Practice
In this geometry activity, students create circle, line and bar graphs using different comparisons of events. There are 24 questions with an answer key.
Curated OER
Stretching the Quads
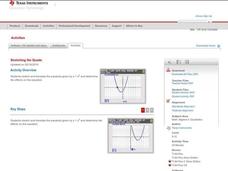
Explore parabolas in this algebra lesson with the graphing calculator. The class investigates what effects the changing of the parameters of the vertex form of a quadrati have to its graph. They find the zeros of a quadratic graphically...
K5 Learning
May the Best Prankster Win
Everyone loves a good prank! With this reading passage, Perla and her grandmother play some fun innocent pranks on one another. Kids focus on new vocabulary words, questions about the information they have read, and responding with their...
Curated OER
Going Back to Your Roots
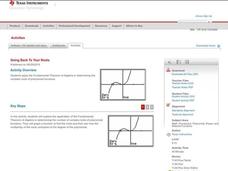
Who doesn't need to know the Fundamental Theorem of Algebra? Use the theorem to find the roots of a polynomial on a TI calculator. The class explores polynomials with one solution, no real solutions, and two solutions. This less...
Curated OER
Going Back to Your Roots
Investigate the Fundamental Theorem of Algebra and explore polynomial equations to determine the number of factors, the number of roots, and investigate multiplicity of roots.
Curated OER
Write a Number Story
Students view number stories at a website and write their own. They insert a drawing and the text of their number story using a software such as PowerPoint to create a presentation for the class and parents.
Curated OER
Exploring Expressions
Examine parts of an expression in this algebra lesson plan. Ninth graders identify the properties of the coefficient and their behavior to the graph. They graph the equation on a TI to see their results.
Curated OER
Pictographs
What do these pictographs show? Scholars analyze three sets of data organized into pictographs, filling in several comprehension questions about each. The first one is done for them as an example, but consider going over it together to...
Curriculum Corner
Winter Multiplication and Division Problem Solving Task Cards
A set of 18 winter-themed multiplication and division word problems is perfect for your math centers right before the holidays. Each problem is numbered and represented on a task card. Young mathematicians write their answers on a...
Chicago Botanic Garden
What Can Tree Rings Tell Us About Climate?
Tree rings are slightly thicker on the south side of the tree because it receives more sunlight. Part two in a series of five lessons helps learners analyze tree rings to determine the environmental conditions that caused size...
World Wildlife Fund
Bar Charts & Pie Charts
Learn about life in the Arctic while practicing how to graph and interpret data with this interdisciplinary lesson plan. Starting with a whole group data-gathering exercise, students are then given a worksheet on which they analyze and...
Normal Community High School
Mole Calculations
You didn't know you'd find moles in chemistry class! Through the introduction of moles and molar volume at STP, classes see how to calculate moles using a given chemical equation. The presentation includes a short review of ions in...
DiscoverE
Sun-Warmed Treats
Treat your class to a fun activity, complete with treats. Groups create a solar oven from a pizza box. They then use it to heat up some food ... that's what an oven is for, after all!
K12 Reader
Order of Adjectives: Add Another
Some nouns need more than one adjective to adequately describe them. Using a reference poster that puts twelve categories of adjectives in order, class members fill in the blanks to complete eight sentences.
Curated OER
Reading Tally Chart
As learners explore data analysis have them practice reading tally charts using these examples. They answer basic questions about each of three charts, employing addition and subtraction skills. For example, a chart tallying t-shirts...
Worksheet Web
Using Pictographs
If one ice cream cone represents three ice cream scoops, and Bob has four ice cream cones, then how many scoops does Bob have? Learners solve these kind of questions with their new understanding of pictographs.
World Wildlife Fund
Arctic Food Chain
Explore the food chains that support Arctic ecosystems. A class discussion on interdependence and the different roles plants and animals play in ecosystems provides students with the knowledge to complete a worksheet asking them to...
World Wildlife Fund
Land of the Midnight Sun
From days of 24 hour sunlight, to endless nights that last for days, the Arctic is a very unique place to live. Examine the seasonal changes that occur in the northern-most reaches of the globe and the impact they have on the plants and...
Curated OER
Your Five Senses
Students identify the five senses. In this biology instructional activity, students participate in an experiment and use their five senses to identify various substances.
SeaWorld
Sharks
Youngsters explore their sense of smell by working in pairs. One child is blindfolded, while the other holds things for him to smell. They switch after a while. All of this leads up to learning about the amazing ability sharks have to...
Curated OER
Real Food in the Classroom
Use a class garden to teach learners about real food, nutrition, and more.
Math Worksheets Land
Pie or Circle Graphs - Guided Lesson
A guided lesson worksheet reinforces pie graph skills using a given set of data. Each problem requires young mathematicians to create a circle graph using five colors, and to provide a key that goes along with the graph.
DiscoverE
Friction in Action
There's no need to have friction among instructors regarding the resource. Pupils investigate how marbles and coins slide along different surfaces which gives them information to estimate coefficients of friction.


