Curated OER
Permutations & Combinations
Young mathematicianss predict the outcome of an event. Learners solve problems using permutations and combinations. They use the TI calculator to see the different combinations and how the groupings occur.
Curated OER
Corn-Crop is a Bin-Buster
Learners calculate percent change and create lists of data. They enter the corresponding bushels of corn measured in billions to their list and display, then convert the acres into scientific notation and use the value on the home screen...
Curated OER
Area "FOILed" Again!
Learners perform factoring on the TI. In this algebra lesson plan, students factor equations using the FOIL method. They use the TI navigator to show each step using a visual.
Curated OER
Corresponding Parts of Congruent Triangles
Students identify different parts of a triangle. In this geometry lesson, students differentiate between similar and congruent triangles. They use the navigator to crate a visual of the different parts of a triangle.
Curated OER
Shedding Light on the Weather with Relative Humidity
Learners study weather using a graphing calculator in this lesson plan. They collect data for temperature and relative humidity for every hour over a day from the newspaper, then place the data in their handheld calculator and examine it...
Curated OER
Multiplying Monomials
High schoolers differentiate between linear and quadratic functions. In this algebra instructional activity, students write equations of graphs and graph a function from an equation. They also identify the slope and y-intercept.
Curated OER
Geometric Sequences and Series
Learners find common ratios of geometric sequences on a spreadsheet. Using this data, they create scatter plots of the sequences to determine how each curve is related to the value of the common ratio. They will consider whether series...
Curated OER
Exploring the Area Under a Curve
Using TI-89, mathematicians explore and investigate Riemann sums to estimate the area under the graphs of intervals by drawing and illustrating rectangles. They review and practice the concepts of summation notation and area formulas to...
Texas Instruments
Areas of Regular Polygons and Circles
Learners explore area of polygons and regular polygons in this math instructional activity. They calculate the area of several polygons using Cabri Jr. and analyze shapes and write formulas to solve for the area.
Curated OER
What's the Spin?
Learners use the CABRI application for their graphing calculator to rotate, translate, and reflect triangles. They use graphing calculators and follow detailed directions to manipulate triangles in specified ways. There are three...
Curated OER
Matrix Multiplication
In this matrix multiplication instructional activity, 11th graders solve and complete 8 different problems that include a number of steps in an activity. First, they use the matrix illustrated to respond to various questions referring to...
Curated OER
Properties of Parabolas
Have your learners investigate parabolas. In this Algebra II lesson, students explore the basic definition of a parabola by using Cabri Jr. to create a parabola given the focus and directrix. Students interpret the equation for a...
Curated OER
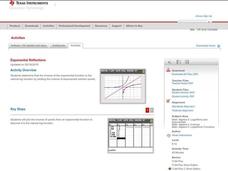
Exponential Reflections
Explore the natural log function through the investigation of inverse of the exponential functions by plotting the inverse of the exponential solution points. Students examine the results to determine that the inverse is the natural log...
Curated OER
Zeros of Polynomials
Young scholars graph polynomials. In this Algebra II lesson, students investigate the graph of a polynomial to determine the value and the number of zeros. This lesson requires the use of a graphing calculator.
Curated OER
Gateway Arc Length
Learners differentiate and calculate the length of an arc. They define an arc and relate it to the area of a circle and integrate the function to solve the equations. Students use their TI calculators to graph the equation.
Texas Instruments
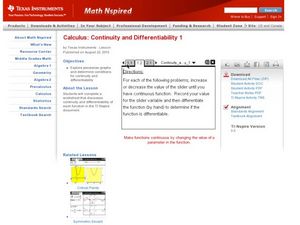
Continuity and Differentiability 1
Pupils examine graphs for continuity and differentiability in this calculus lesson. They observe piecewise functions to see where continuity and differentiability come into play. Learners finish by graphing their equation on the TI...
Texas Instruments
Integration By Parts
Pupils solve problems using integration by parts in this calculus lesson. Learners apply the product rule and integration by parts. They graph the equation and use the TI to observe the integration process.
Curated OER
Infestation to Extermination
Students solve problems with exponential growth and decay. In this calculus lesson, students relate exponential functions to infestation and extermination. They take the derivative to find their answer.
Curated OER
Parametric Races & Slopes
Learners investigate the slopes and parametric equations. In this calculus lesson, young scholars solve parametric equations with specific parameters. They relate lines and slopes based on the derivative of the equation.
Curated OER
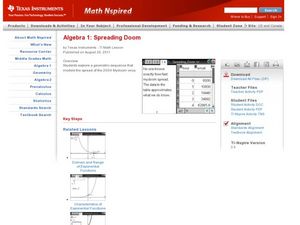
Spreading Doom
Students explore the pattern created by a sequence or series. For this geometry lesson, students relate the spread of a virus to the growth of exponential functions. They collect data as they analyze the sequence created by the growth.
Curated OER
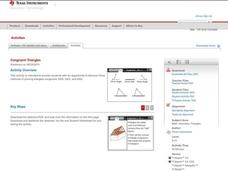
Congruent Triangles
Students identify properties of triangles. In this geometry lesson, students differentiate between similar and congruent triangles. They use the umber of sides to help define the angle of the polygon.
Curated OER
Rhombi, Kites, and Trapezoids
Students identify the number of diagonals for each polygon. In this geometry lesson plan, students identify the polygons based on their diagonals and the way it intersect. They create visuals using the navigator to see the changes in the...
Curated OER
Watch Your P' and Q's
Pupils solve polynomial functions by graphing. They factor rational expressions to find the roots of the equation and apply the rational zero theorem to find the zeros of a polynomial.
Curated OER
Permutations
Learn how to solve the probability that an event will occur. Learners also employ permutations and combinations to find the amount of time it takes for an event to occur. They use the Ti to create a visual of the events.


