Curated OER
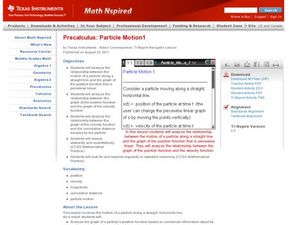
Particle Motion1
Students analyze piecewise functions. In this precalculus lesson, students identify the position, velocity and distance. They analyze the relationship between the graph, its position and velocity.
Curated OER
Inequality Shading Investigation
In this inequality instructional activity, students graph the inequality of a line. They list ten integer coordinates that lie on the grid. Students explore their findings and answer thought questions. They shade the graph to indicate...
Curated OER
What Pie?
Students practice making and interpreting pie graphs so they are better able to decide if a pie chart is the appropriate form of display. Students examine included overheads of different pie charts, and directions on how to make pie...
Curated OER
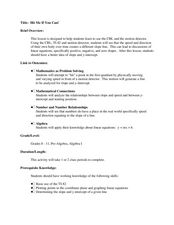
Hit Me If You Can!
Students graph linear equations using slopes and intercepts. In this algebra lesson, students identify the slope as being positive,negative or undefined. They differentiate between different quadrants on a coordinate plane.
Curated OER
Motion of a Bowling Ball
Students experiment with distance, speed, and motion by graphing the motion of a bowling ball. In this distance versus time graphing lesson plan, students observe the speed and distance of a rolling ball and graph their findings. They...
Curated OER
Let's Get Physical
Students collect data using the CBL. In this statistics lesson plan, students predict the type of graph that will be created based on the type of activity the person does. The graph represents heart rate depending the level of activity.
Curated OER
Stemmin'-n-Leafin'
Students make stem and leaf charts to determine the measures of central tendency using test score data. They analyze the data to draw inferences which they share with the class. They complete the associated worksheets.
Curated OER
Breakfast Cereal - How Nutritious Is Yours?
Students analyze the nutritional value of breakfast cereal in order to make an informed choice. They create a stem and leaf plot which analyzes the nutritional value of the cereal they eat on a regular basis. Students write a letter to...
Curated OER
Linear Regression on TI-83
In this linear regression worksheet, students use TI-83 calculators to graph linear regressions. Instructions for using the calculator are provided. This two-page worksheet contains six problems.
Curated OER
Linear Regression on TI-82
In this linear regression activity, students graph linear regression problems using the TI-82 calculator. Instructions for using the calculator are provided. This two-page activity contains six problems.
Curated OER
Halloween Graphitti
Students complete multi-curricular activities in a Halloween themed lesson. In this Halloween lesson, students examine newspaper ads to find prices of pumpkins and use them to complete a stem and leaf plot. Students find the diameter,...
Curated OER
The 400-Meters Race
Students collect and graph data. In this algebra lesson, students describe, interpret and analyze data. They follow a 400 meters race and plot the coordinates of the course. They graph a line to represent the data of the course.
Curated OER
Round and Round and Round We Go!
Students investigate motion using a CBL. In this algebra lesson plan, students collect and graph data on a coordinate plane. They define and identify amplitude and period of conic graphs.
Curated OER
Motion Musing
Students investigate graphing a line. In this algebra lesson, students collect data on the path of a skateboarder. They collect how fast the board is traveling along a straight line and graph their results.
Curated OER
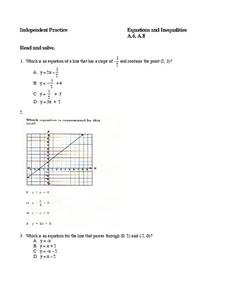
Equations and Inequalities
In this equations and inequalities instructional activity, 9th graders solve and complete 10 different multiple choice problems. First, they determine the equation of a line that has a given slope and contains a point. Then, students...
Curated OER
A.P. Calculus - First Semester Esxamination
In this calculus exam worksheet, students solve 40 multiple choice and short answer questions. Students find normal lines, derivatives of functions, evaluate functions at points, etc.
Curated OER
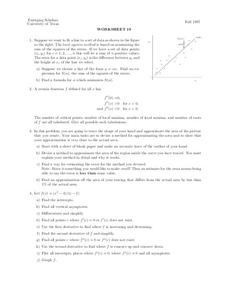
Worksheet 19
In this math worksheet, students try to fit a line to a set of data. Then they use the least squares method is based on minimizing the sum of the squares of the errors.
Curated OER
College Prep Algebra, Worksheet Chapter 3, 2.5, 2.7, 3.1- 3.4
In this algebra worksheet, students translate 39 word problems into algebraic terms and solve them. They complete 42 problems about coordinate graphing, working with ordered pairs, slop, and equations of lines.. They make 2 scatter grams...
Curated OER
Constructing and Solving Linear Equations
Students construct and solve linear equations. In this algebra lesson, students solve equations and graph lines using the slope. They identify the different parts of an equation including the leading coefficient.
Curated OER
Linkages Between Surface Temperature And Tropospheric Ozone
Students collect and interpret data to make predictions about the levels of ozone in the atmosphere. Using the internet to collect data students use their collected data to create a line graph for analysis. Students make mathematical...
Curated OER
A Colony is Born : Lessons 7 - 10 What's My Line?
Fifth graders research their assigned regions, complete regional guide and prepare presentations about the New World colonists. They refer to "Everyday LIfe: Colonial Times" as well as searching marked internet sites.
Curated OER
Raisin the Statistical Roof
Use a box of raisins to help introduce the concept of data analysis. Learners collect, analyze and display their data using a variety of methods. The included worksheet takes them through a step-by-step analysis process and graphing.
Curated OER
WHAT IS THE POPULAR COLOR?
Fourth graders graph cars according to their colors. They complete the graph including a title, scale, x-axis, and y-axis. Students collect the data and choose the type of graph to be made.
Curated OER
Evidence of Change Near the Arctic Circle
Students analyze graphs and make conclusions about climate change. In this climates lesson plan students produce graphs and identify relationships between parameters.


