Curated OER
Oceania Map Quiz
In this online interactive geography quiz worksheet, students respond to 14 identification questions about Oceania. Students have 2 minutes to complete the quiz.
Curated OER
Australia Cities Map Quiz
In this online interactive geography quiz worksheet, students respond to 17 identification questions regarding Australian cities. Students have 3 minutes to finish the timed quiz.
Curated OER
Chinese Cities Map Quiz
In this online interactive geography quiz instructional activity, students respond to 10 identification questions about Chinese cities. Students have 3 minutes to complete the quiz.
Curated OER
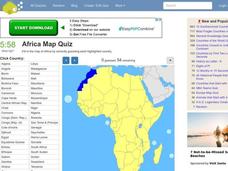
Africa Map Quiz
In this online interactive geography quiz worksheet, students respond to 53 identification questions about the countries of Africa. Students have 6 minutes to complete the quiz.
Curated OER
Spanish Cities Map Quiz
In this online interactive geography quiz worksheet, students respond to 11 identification questions about Spanish cities. Students have 3 minutes to complete the quiz.
Curated OER
Memoir
After reading and analyzing two narrative memoirs, middle schoolers engage in a variety of activities, including writing an essay, developing a story map, and creating character charts. They then compare and contrast story maps, and...
Curated OER
Non-Fiction Text Features
Distinguish between textual features of non-fiction in the book The Lewis and Clark Expedition and in the non-fiction story "Ta-Na-e-Ka." Third graders create posters and participate in group discussions to show their...
Curated OER
The Cold War (1945-1991): An Ideological Struggle
Covering the main topics of the Cold War, including some excellent discussion points on the methodologies of the Soviet and Eastern Bloc nations versus the US and Western Democracies, this presentation is a good way to introduce the...
Curated OER
The Geography of Japan
A comprehensive look at Japan and its characteristics will engage and inform the viewer about one of the most prominent powers in the world today. The demographics, topography, and climate of Japan are covered in these slides with maps,...
Curated OER
Human Genetic Diseases
Although there are a few missing titles in this collection of slides, if your class has the support of a genetic disease lecture to accompany it, this resource will be very useful. The mechanism of genetic inheritance is covered. Flow...
Curated OER
Human Genetic Diseases
Although there are a few missing titles in this collection of slides, if your class has prior knowledge of genetic diseases then this resource could be useful. The mechanism of genetic inheritance are covered and both flow charts and...
Ontario
Reading Graphic Text
Do students really need to be taught how to read cartoons, comic books, and comic strips? Yes. Just as they need to learn how to read other forms of graphic text such as diagrams, photos, timetables, maps, charts, and tables. Young...
National Nanotechnology Infrastructure Network
What’s In Your Neighborhood?
Chart your way to an understanding of nanoscale. Using a Google map, learners estimate a radius around their location of 1,000 and 1,000,000 meters. Predicting what 1,000,000,000 meters would look like takes them off the charts!...
ProCon
Israeli - Palestinian Conflict
Many people think the best solution to the Israeli-Palestinian conflict is a two-state solution. After reviewing the available resources, scholars determine whether they agree with that approach. They analyze graphs and charts about...
Curated OER
Population Density
Students examine world population density and population distribution. They create pie charts showing population distribution and analyze population patterns in the United States and major regions of the world. They identify...
Curated OER
Where Are the Bugs?
Students trap, collect and identify arthropods in a newly created desert tortoise preserve area over a period of one school year. They determine the rate at which various arthropods take up residence in the newly landscaped area. Data is...
Curated OER
Where is Everybody?
Middle schoolers collect data from different grade levels at their school and develop thematic maps which show population density, and determine how this might affect the school and themselves in the future.
Curated OER
What's For Dinner?
Eighth graders discover how the location of restaurants affects the future location of different restaurants. Using a fictionous town, they map the locations of all current restaurants and analyze the data to determine what type of...
Curated OER
Special Education Fitness Challenge
Make fitness a part of each and every day. Special Ed students are given charts with maps and record keeping information. They are given a 20-week period (late October to late March, when the weather is cool enough) to walk that...
Curated OER
The Brief American Pageant: The Resurgence of Conservatism
Take a short trip back in time with this presentation, which details the political and electoral contexts of 1980's and 1990's America. Covering the Gulf War as well as domestic economics, these slides feature easy-to-read charts and...
Curated OER
Exploring Wyoming Species Habitats
Learners are introduced to the concept of species habitats and ranges. They introduced to ArcView GIS as a tool for mapping. Pupils use query data for species withina county, elevation, range, rivers and streams, land cover, and etc....
Curated OER
From There To Here...
Students find out where some of the products in hour homes come from, then become aware of our local trash, landfills and incinerators. They chart and graph data and use maps for different purposes.
Curated OER
Sea Changes: A New England Industry
Students conduct research in order to use primary and secondary sources. They interpret and analyze information from textbooks and nonfiction books for young adults, as well as reference materials, audio and media presentations, oral...
Curated OER
The Brief American Pageant: The American People Face a New Century
The political landscape of Y2K is the focus of this series of slides, which cover the later years of the 20th century. Charts detail the poverty and social welfare rates in the 20th century, as well as a pie graph displaying the sources...
Other popular searches
- Analyze Maps and Charts
- Reading Maps and Charts
- Charts and Maps
- Ireland Maps and Charts
- Tables, Maps and Charts
- Maps, Charts, Globes
- Graphs Charts and Maps
- Interpreting Charts and Maps
- Tables Maps and Charts
- Graphs, Charts and Maps
- Graphs\, Charts and Maps
- Charts, Graphs, Maps


