Curated OER
Social Studies: Area and Population Density
Math scholars of many ages examine the concept of population density and then discuss the significance of the population densities of Minnesota and China. They figure the population density of their school.
Curated OER
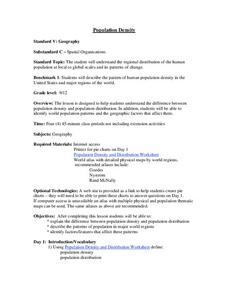
Population Density
Students examine world population density and population distribution. They create pie charts showing population distribution and analyze population patterns in the United States and major regions of the world. They identify...
Delegation of the European Union to the United States
The Geography of Europe
What is the European Union? Where is it? Why is it? To begin a study of the EU, class members examine the physical geography of Europe and the size and population density of 28-member countries in comparison to non-member countries...
Curated OER
Size It Up: Map Skills
Compare information from a US population cartogram and a standard US map. Learners draw conclusions about population density by analyzing census data a population distribution. They discover that census data is used to apportion seats in...
Curated OER
How Big is Big?
Geography learners compare and contrast population densities throughout the world. Using maps, they estimate the relative size of the world's regions and populations. They develop analogies to discover the world they live in and...
Curated OER
Carbon Monoxide and Population Density
Tenth graders investigate the carbon monoxide level at a fixed latitude. They determine if there is a relationship to population density. They download data sets and generate a graph. They determine a link between human activity and...
Curated OER
Population and Population Density
Students read and interpret graphs. In this population lesson, students explore population and population density as they read several data graphs and respond to questions.
Curated OER
Where is Everybody?
Students collect data from different grade levels at their school and develop thematic maps which show population density, and determine how this might affect the school and themselves in the future.
Curated OER
A Look at the Population Density of the United States
Young scholars acquire census information and create maps of the population density of the United States on different scales. They role play the roles of workers of a retail company and they use the population data to market to their...
Curated OER
Carbon Monoxide and Population Density
Tenth graders investigate the carbon monoxide level at a fixed latitude to determine if there is a relationship to population density. They download data sets and generate a graph, and find locations using the Earth's coordinate system....
Curated OER
Mapping Counties
Students practice reading a map. In this mapping lesson, students illustrate a map and compare and contrast the counties based on their population. Students also explore what a census is and read census data on a map. A student...
Curated OER
Population Densities
Students explore biological impact by completing a worksheet in class. In this animal population lesson plan, students utilize river rocks and jars to conduct a coqui frog population role play activity. Students define a list of...
Curated OER
Where Should We Put a Store?
Young scholars analyze population data. They convert population data into simple density maps to help make decisions about their world. They select the best location for a school store based on population density. They present their...
Curated OER
Asia Crossword
In this geography instructional activity, students complete a crossword puzzle on the continent of Asia. They answer 21 questions related to the type of government systems found, capital cities, deepest lake, and lowest population density.
Curated OER
Population and Productivity: Two P's in a Pod
Students investigate the link between countries' population growth rates and levels of industrialization. They observe that, over time, as a country becomes more industrialized, its population growth rate decreases.
Curated OER
Where We Live
Students forecast future population growth of the U.S. Virgin Islands. In this U.S. Census lesson plan, students explain the factors that influence population density on the U.S. Virgin Islands, including geography and economic activity.
Curated OER
Annual Wetland Plant Diversity Survey
Students locate an area of marsh and, by measuring the total number of individual plants in a sample area, determine whether purple loosestrife population density is correlated to the total plant diversity of the community. They...
Curated OER
Mapping Districts
Students use maps to learn about the U.S. Census. In this 2010 Census lesson plan, students visualize census data on maps, use map keys to read population maps, and explore the concept of population density.
Curated OER
Mapping Districts
Students become literate in their use of maps. In this 2010 Census lesson plan, students visualize census data on maps, use map keys to read population maps, and explore the concept of population density.
Curated OER
Lesson 2: Mapping Sub-districts
Learners learn more about the census. In this mapping sub-districts lesson plan, students visualize census data on a map, use a map key to read a population map, and better understand the concept of population density.
Curated OER
Why We Count
Students visualize census data on a map and use a map key to read a population map. For this census lesson, students use a map of the Virgin Islands and corresponding worksheets to gain an understanding of population density.
Concord Consortium
School Bus Routes
Plan the way to school. Given a map of a school district, class members portray a transportation consultant hired to develop a bus transportation plan that will pick up the eligible riders and get them to school. The plan must contain...
Curated OER
Plotting Slave Population Density in Connecticut in the 1700's
Tenth graders explore slavery in the U.S. by researching the web. In this U.S. history lesson plan, 10th graders identify the geography of Connecticut and the overall involvement the state had in the slavery process. Students view data...
Curated OER
WorldWatcher Activity: Investigating Population and Carbon Emissions
Young scholars develop a population density visualization chart to begin the lesson. In groups, they use this information to compare to rates of carbon emissions for their country. They identify solutions to the problem and present...


