Curated OER
Why NP Min?
Students calculate the normal distribution. For this statistics lesson, students use the normal distribution to estimate binomial distributions. They define when to use NP and n(1-p) to make approximations.
Curated OER
Confidence Levels
Learners collect data and graph it. In this statistics lesson, students rate confidence levels by collecting data and analyzing it. They graph their findings on the Ti calculator.
Curated OER
The IMF in Action: What Does the IMF Do?
High schoolers use newspapers and the internet to discover what the IMF does. They work together in groups to brainstorm occupations which need another language to be spoken. They also examine data related to trading among countries.
Curated OER
Monsoon Winds to the "Land of Gold"
Students recognize environmental factors that influenced maritime trade routes and the establishment of major trading centers in classical times. They evaluate perceptions of the ancient world through ancient maps and primary source...
Curated OER
Huddle up with a Character based Economic Plan to help Community Friends
Young scholars complete Perseverance, Courage, and Caring lessons from Get into the Game: Beyond Winning to properly prepare students for cooperative group learning and create a class climate conducive for a successful unit. They create...
Curated OER
Total English Upper Intermediate: The Power of Persuasion
In this gerunds and infinitives practice worksheet, students complete 10 sentences as they fill in each of the blanks with a gerund or infinitive. Students then complete 8 sentence starters with the appropriate gerunds or infinitives.
Curated OER
How Much is a Pound? A Weight Lesson
Fourth graders explore weight in pounds. In this measurement lesson, students estimate the weight of teacher-provided objects, measure the actual weight of the objects using scales, and discuss food products sold by the pound. This...
Curated OER
Using Symmetry to Find the Vertex of a Parabola
Learners engage in a lesson that is about finding the vertex of a parabola while using symmetry. They use the symmetry to find out where the two lines meet. The line is displayed with the help of a graphing calculator. The lesson...
Curated OER
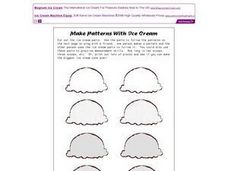
Make Patterns With Ice Cream
In this ice cream patterns worksheet, students cut out ten scoops of ice cream and two cones. Students team up with a partner and exchange matching different patterns for the other one to model.
Curated OER
Dr. Seuss Reading Search
In this Dr. Seuss reading comprehension worksheet, students read a selection about the author before answering 6 questions based on the reading.
Curated OER
Count the Differences
Pupils find the difference between consecutive y-values on the calculator and write an equation that fits the data. They continue finding the differences in consecutive y-values using lists on their calculator. Learners conclude as they...
Curated OER
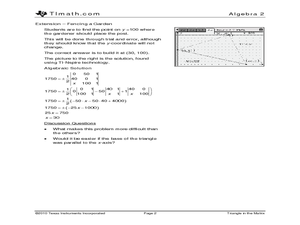
Triangle in the Matrix
Young mathematicians represent a triangle with a matrix and use the determinant to find the area of three given triangles. Learners also verify the formula for area of a triangle.
Curated OER
Vikings
In this Vikings worksheet, students read a passage on the Vikings, answer short answer questions, draw, and research the internet. Students complete 4 activities.
Curated OER
Proportions in Stories
Young scholars solve problems dealing with ratios and proportions. In this algebra lesson, students rewrite word problems using equations and symbols. They correctly convert between percents and decimals.
Curated OER
The Distributive Property
Students solve problems using the distributive property. In this algebra lesson, students solve equations by multiplication and combining like terms. They graph their lines on the calculator.
Curated OER
Trains in Motion
Students compare two object as they find the distance between them. In this geometry lesson, students create an equation describing the distance of time as a function. They use the navigator to observe the distance.
Curated OER
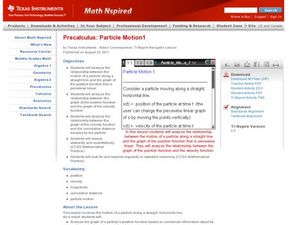
Particle Motion1
Students analyze piecewise functions. In this precalculus lesson, students identify the position, velocity and distance. They analyze the relationship between the graph, its position and velocity.
Curated OER
Particle Motion 2
Students analyze the motion of a particle along a straight line. In this precalculus lesson, students use the TI to analyze the position of a function as they graph and visualise the function. They calculate the distance and velosity of...
Curated OER
Slope and Tangent
Students differentiate between the slope and the tangent of the horizontal. In this precalculus lesson, students examine slopes created by tangent lines. They observe the angle formed using properties of the unit circle.
Curated OER
Center of Mass
Students identify the geometric mean of their data. In this statistics lesson plan, students collect data and graph their findings. They identify the mean, range and mode.
Curated OER
Probability Distributions
Students collect and plot data on a graph. In this statistics lesson, students analyze the distribution of a sample and predict the outcome. They find the line of best fit and discuss what would make the sample larger.
Curated OER
Meaning of Power
Pupils graph exponential and power functions. In this statistics instructional activity, students test a specific hypotheses and draw conclusion. They use the graph of polynomials to test and draw their conclusions.
Curated OER
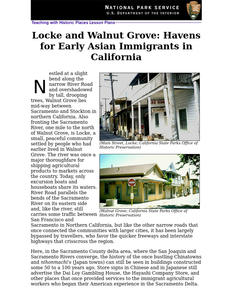
Locke and Walnut Grove: Havens for Early Asian Immigrants in California
Students use readings, maps and photos to examine the life of Japanese-American immigrants in Locke and Walnut Grove in the early 1900s. They discuss their research findings, role-play the lives of immigrants and write responses.
Curated OER
The Statistics Sampler
Students define sample, describe a random sample, and discuss what compromises a sample. They determine a sample size to estimate a population characteristic with confidence.
Other popular searches
- Advertising and Marketing
- Food Advertising Marketing
- Advertising/marketing
- Marketing Advertising Budget
- Sports Marketing Advertising


